MA with bands scalping
Submit by Dave (written by Ben Agham) 21/02/2017
Ma histogram scalping is an intraday system trend-momentum based on moving average and Bressert Stochastic oscillator. The but of this system is find the best trades with less loss. This system is able to identify good trading opportunities.
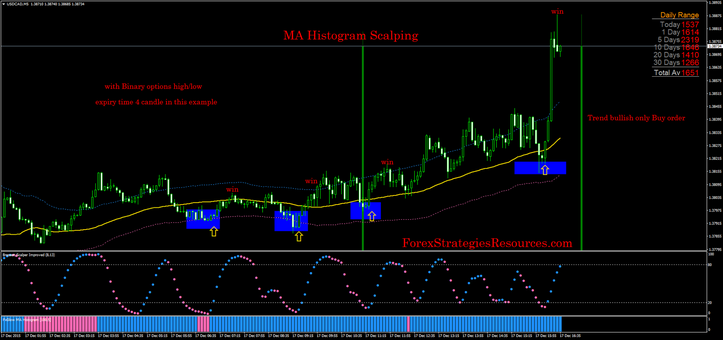
This system is designed for the intraday trading but can also be used in swing with appropriate settings. In addition to time frames of 5 min or 15 min it can be used for trading binary options high / low (expiry time 4-6 candles).
Metatrader Indicators:
Any candle,
Targgets Bands,
DSS bressert stocastic oscillator (8, 13),
MA Histogram ( 5, 100).
Trading rules MA Histogram Scalping
Buy
1. Trend of the day is bullish (daily candle color green);
2. MA Histogram (100, 5) is color blue;
3. Price is above middle band or upper band;
4. DSS Bressert stochastic the dots went below 20 level and color turns blue;
5. Buy order when DSS Stochastic becomes BLUE and bar is closed.
Sell
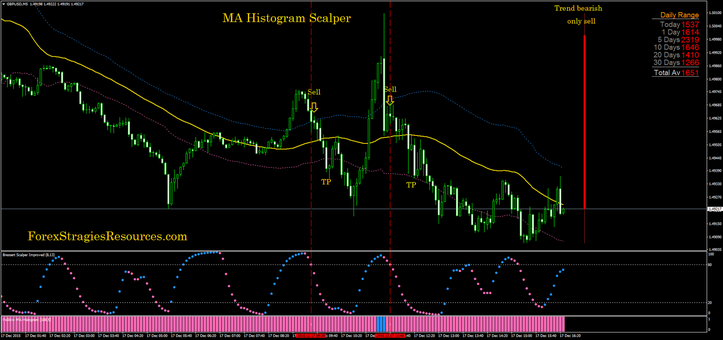
1. Trend of the day is bearish (daily candle color green);
2. MA Histogram (100, 5) is color red;
3. Price is below middle band or lower band;
4. DSS Bressert stochastic the dots went above 20 level and color turns red;
5. sell order when DSS Stochastic becomes red and bar is closed.
Exit position
Place initial stop lolss on the previous swing high/low.
Make profit at the middle band or opposite band or with predetermine profit target that depends by time frame and currency pairs.
In the pictures MA Histogram Scalping in action.
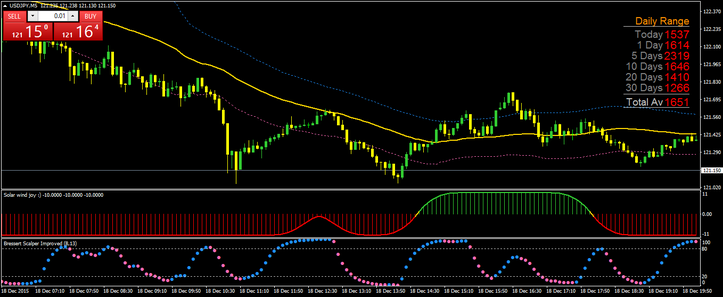
MA histogram replaced by solar wind joy indicator (50 period, smooth 10).
Trading with the same rules.
Solarwind Joy is a repaint indicator (but this setting is very slow).


Комментариев нет:
Отправить комментарий