Formula scalping system
Submit by Dimtry 06/2017
Forex Power Trade Formula – Scalping, works with any currency pair and it’s best to be used with 15M time frame or higher.
System’s Indicators
Each set of indicators used with the system, is used for a specific purpose to do a specific job. In this section we’ll explain the indicators used by the system and why we are using them.
1 – Trend Following and Trend Breakout Indicators
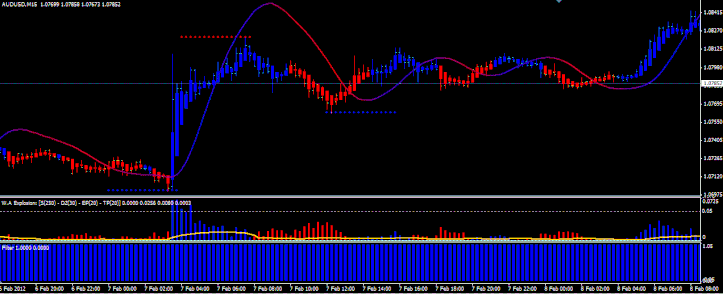
W.A Explosion indicator is used to avoid trend breakouts and trade only when market is quiet and safe for scalping .Trend Filter indicator will be used for trend following. Both indicators are provided with colored bars and specific levels that you will learn how to use them later. Blue Bar = Up Trend/Up Trend Breakout. Red Bar = Down Trend/Down Trend Breakout.
2 – Wave Analysis Indicators
T3 MA indicator is used to show us the direction of the current wave. While Candles indicator show us the same thing but based on different calculations and with colored candles instead of MA line. MTF fractals are used to identify tops and bottoms. As with trend indicators, the colors represent the wave’s direction. Blue Line/Candle/Dot = Up wave. Red Line/Candle/Dot = Down wave.
System’s Rules
There is only one rule for this system : “Follow the trend and ride the wave!”
First of all, how we follow the trend? We will follow all indicators that provide us with clear trend direction and we will follow the trend only when market is quiet and safe.
Here is an example ( Up Trend )
With the scalping system we’re not looking for breakouts, we should avid breakouts and look for WA Explosion indicator to tell us that the market is now quiet and safe. In addition to that you should trade when US and EUR markets are closed if you’re going to trade EUR/USD for example.
How do we know – from WA Explosion indicator – that this is good time for scalping or not? We simply make sure that the indicator’s bars are below breakout levels – 0.05 and 0.075 and 0.1
Notice in the above examples how price is below the 0.05 level ( blue bars ) while the trend’s filter is showing a clear up trend? That’s exactly what we would be looking for. First indicator – T3 MA – is blue = up wave. Second indicator – Candles – is also blue = up wave.
Entry Signal:
In up trend we need to see a signal from the MTF fractals indicator ( blue dots ) example:
In down trend we need to see a signal from the MTF fractals indicator ( red dots ) example:
Target and Stop loss:
For Scalping, Targets for buy/sell trades are from 3 to 10 pips max. there is no need to use targets indicator but you can add it for visual guidance if you wish. The goal with scalping is to get in-out fast and not to keep a trade open for long time. So once a trade is opened and you start to see positive pips, close it manually or place a trailing stop and let the market go on with
it, if a sudden reversal happened the trailing stop should close the trade automatically. Just make sure that your trailing stop’s value is small enough to catch small movements. If you don’t know how to use trailing stops or you don’t prefer to use it, then close the trades manually.
Stop loss for buy/sell orders are few pips away from entry signal ( MTF fractals indicator )
Example:
No Trade – Mixed Signals – Side Ways Market
This is very important situation and most trading systems fail because they can’t identify side- ways market and produce false signals that burn all profits made all week/month in few hours!
How to identify sideways market with Forex Power Trade Formula?
There are many signals that would show very clearly that current market is sideways and you best stay away or trade a different pair. But all of them mean one thing: mixed signals from the system’s indicators.
Example:
Share your opinion, can help everyone to understand the forex strategy.
PTF Power Trade Formula Scalping
PTF Power Trade Formula Scalping
PTF.rar
compressed file archive 109.9 KB


Комментариев нет:
Отправить комментарий