суббота, 15 сентября 2018 г.

Super Apit 8 Trading System

Submit by Ketang 27/11/2011
Time Frame 15-30 min
pairs:any


See Manual guide

Indicators:

NO 1 Signal Bars V8 – utk mengukur tahap kekuatan MACD, STR & EMA
NO 2 B – clock – utk melihat masa yang ada disetiap bar
NO 3 iMAX – menunjukkan trend semasa
NO 4 Braintrend sig – menunjukkan arah dengan panah & alert
NO 5 AA HHLL – menunjukkan tahap highest high & lowest low..go short & go long adalah
ditahap highest low & lowest high yg berkemungkinan berlaku perubahan arah semula.

NO 6 MTF CCI bar – untuk filter trend utk wick semasa ada 5 warna :
- biru cerah = maks buy
- biru gelap = buy
- merah cerah = maks sell
- merah gelap = sell
- grey = trending @ sideway
NO 7 Wick – hijau wick buy … kuning wick sell
NO 8 NVO - Putih diatas = breakout
- Kuning = strong to breakout
- lime = medium strong
- green = baru bermula @ penghabisan
- putih dibawah = lemah

NO 9 Volume average – warna grey (tinggi bar tinggilah volume)
NO 10 GP trend – filter utk strenght bar
NO 11 My forex VQ – ada panah utk trend bertindak spt stochastics
NO 12 Absolute Strenght – utk kekuatan sesuatu trend


In the picture Super Apit trading system in action.

Share your opinion, can help everyone to understand the forex strategy.

Download
indicators.rar
compressed file archive 99.6 KB
Download
Metatrader Template
template.rar
compressed file archive 2.8 KB
Download
Trading System Super APIT 8 USER Guide
Super8 penerangan.pdf
Adobe Acrobat Document 1.9 MB

RSI and Bollinger Bands Trading

TheRSI is a quality indicator for trend. I believe this and i am going to explain another profitable way of
combining it with the Bollinger Bands for good result.


INDICATORS: Relative Strength IndexBollinger Bands (all default Settings)
TIME FRAME: 4HR AND 30MIN (You could also use 30min and 5min)
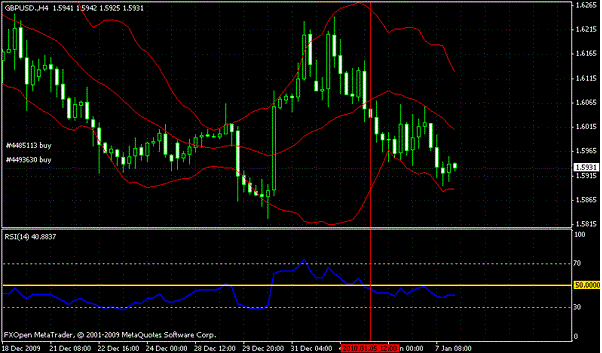
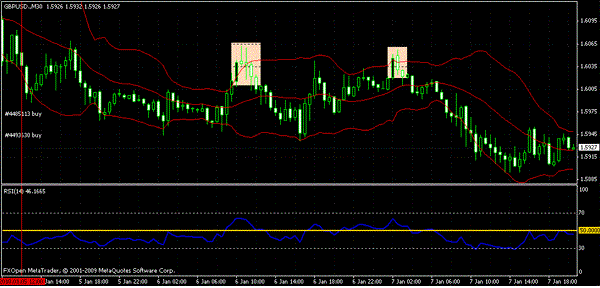
Its very simple; apply the bollinger band to all time frames but its needed in 30min timeframe. In the 4hr
apply the RSI. When RSI is above 50, its uptrend and below 50 is down trend. Then move to 30min for entries.
While in the 30min time frame, in an uptrend, wait for price to close below the lower band of the Bollinger, then a close above the lower band will make your entry for LONG

RSI And Bollinger Bands MTF
While in the 30min time frame, in a downtrend, wait for price to close above the upper band of the Bollinger, then a close below the upper band will make your entry 
for SHORT

 
Exit Position
Profit Target on band middle band or profit target predetermined.
Stop loss pn the previous swing.


Share your opinion, can help everyone to understand the forex strategy.

Z-Winner Trading System

THE SETUP:
Time Frame: 15 Minutes and 1 Hr whichever you prefer
Instrument : All Major Pairs
Trading Time : US Session 7:00 to 17:00 Eastern Time
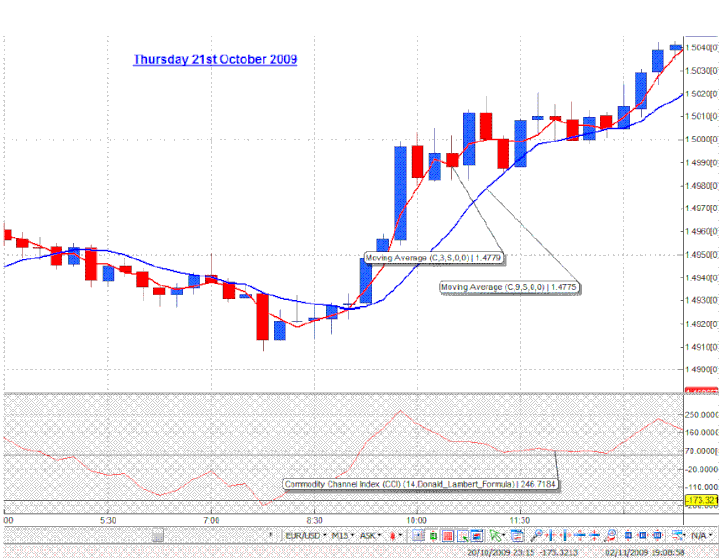
Indicators: CCI 14 Period, Delete +100 and -100 Horizontal lines and add +50 Horizontal line instead.
Moving Averages : 3SMA and 9SMA

 
HOW TO TRADE
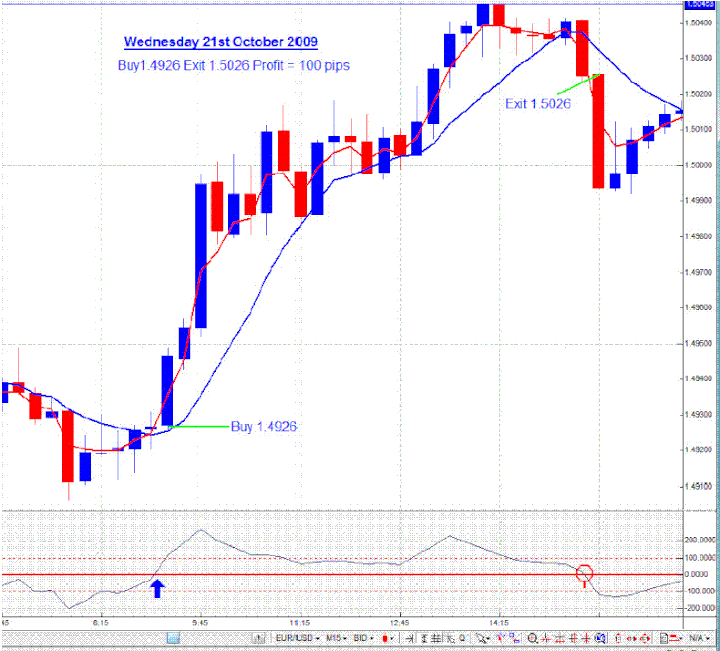
Here is an example chart showing how the Z-WINNER System is traded.
As I mentioned earlier, its a very simple and easy system to trade, we look for the CCI to crossthe +50 line
(marked in red) either from above or below.
In the following example chart, the CCI crossed the +50 line from below ( Blue Arrow) giving us a Buy
Signal and as soon as the next candle opened, we went long at 1.4926.
We also got entry confirmation by the 2 SMA crossovers a little earlier.
Before we start our trading in the morning, we must make a note of the time of News Releases.
STOP LOSS
Always place your Stop Loss 2 pips above the most recent Swing High if you are Short and if you are Long then place your Stop 2 pips below the most recent Swing Low.
It is very rare that you would get stopped out but it is wise to place your stops for reasons beyond your control such as Power Failure or Computer Crash, an Earthquake, Bomb Blast, or Sudden Change in the Market.

Once you are in the Market and the trade is going nicely in your favour, stay in the trade until you see the Exit Signal marked with a red circle on the chart below or just before the end of the US Session at 17:00 Eastern Time.
We get our Exit signal when we see the CCI crossing the +50 line from the opposite side. Please see the chart
below. We got in the market at 09:15 ET and we exit at 15:30 ET at 1.5026, making 98 pips Net Profit.
See Manual...


In the picture Z Winner trading system in action.

Share your opinion, can help everyone to understand the forex strategy.

Download
Z-Winner Trading System
Z-Winner.rar
compressed file archive 1.6 MB

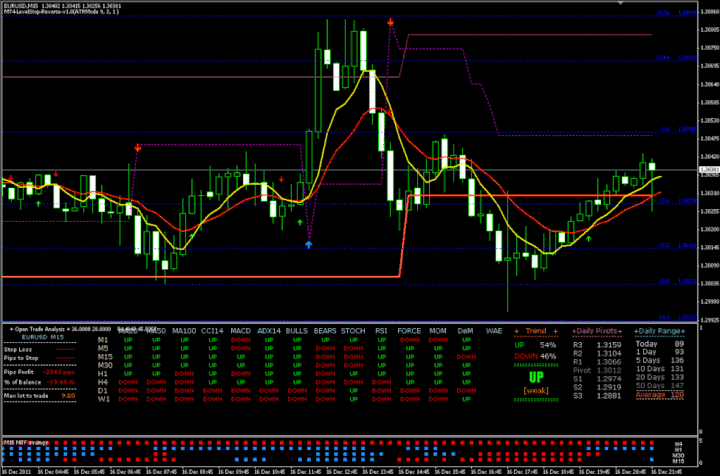
Secret Weapone Trading system

Two Strategies

An intraday trading strategy using the ema and ma crossover indicators. I use the QQE MTF5as a confirmation indicator only. This strategy can be used on any timeframe but I prefer the 1 hr timeframe. You are free to test other time frames if you so desire. You can use the 30 min and 15 min timeframe for better entry points.


When you get a signal from the MA crossover indicator and the M15 MTF signal turns to black , it is time to trade. Make sure that the 5SMA crosses up and over the 12 SMA for better entry points and the M15 MTF indicator either turns black or the opposite color They will usually cross before the signal is generated. The signal is just a confirmation signal only.
You trade in the direction of the arrows. Do not trade if the QQE has not crossed. 85-90% of the time the QQE will cross before you get an up or down signal so that will eliminate the false breakouts. Your take profits will be your 1st Fib Support or Resistance Line or you can use the points are on your chart under daily pivots. You the trader will make that decision. When you are trading this strategy make sure that trend is going in your direction. I prefer a strong trend which is over 75% but by that time your move may be already ready for a retrace. As long as your other indicators still agree with one another it is still a safe trade.

Just move up your stop losses to minimize your losses or lock in profit if the trade suddenly reverses. When the trend starts dipping to the 50-50 level and the QQE starts turning in opposite direction, I will close my trade regardless of the situation as this usually means a ranging market is in store or the short term trend is reversing.
Now we will get into the daily pivot strategy

Look at your chart. Observe the bold tomato colored line. This is your daily pivot point. Details of what a daily pivot was outlined in the auction

To utilize this strategy look where the price action is compared to the daily pivot. If the price action is significantly higher or lower than the daily pivot then there will be no trade at this time. You can utilize the other strategy at this time.


When the price starts getting near the daily pivot then a possible trade setup is near. We only enter the market if the price closes above or below the daily pivot and above or below the 200 sma on the 1hr chart only. For example, if candle closes above the daily pivot and price closes above the 200 sma, then you would be in a buy position. If the candle closes below the daily pivot and candle closes below 200 sma, then you will sell. Make sure the QQE indicator is in agreement before entering a trade as it may range for a few hours before the price starts going below or above the daily pivot. Make sure the candle closes above or below the 200 SMAbecause a lot of times there will be a significant bounce off that level so be prepared to adjust your stop loss accordingly! Use of an additional momentum indicator is recommended. It is pre-loaded in your metatrader platform Setting should be set to 10. You can also use the 15 minutechart but instead of using the 200SMA use the 100 SMA

There are 3 daily pivots that we will speak of and the only 2 that is worth mentioning is the London daily and the US daily. This indicator automatically adjusts for these time zones. London daily pivots starts at 3amEST and US starts at 8amEST. Most of the big price moves are in these time periods and therefore are the best times to place your trades.


I have also included an additional daily pivot indicator called the Exit_-_1hr
This calculates the daily pivot point thruout the day. Add it to your charts and you take the value of the top line, subtract the value of the bottom line and divide that value by 2 to get an up to the hour daily pivot

For example if top line of GBP reads 2.0400 and bottom line says 2.0250 you would subtract:

2.0400
-2.0250
----------
0.0150/2 = .0075

2.0400
-0.0075
-----------
2.0325 would be your daily pivot


Indicators:
a). Simple Moving Average
Values:
5 Close and 100 close

c). Level stop Reverse
Values:
Use ATR mode True
Non-ATR stop pips 40
ATR Periods 28
ATR Multiplier 2.0
ATR Smoothing 0
D).QQE on 1min and 15 min time frames (3 indicators)
Values:
Smoothing Factor 60 (QQE 60)
Smoothing Factor 5 (QQE 5)
Smoothing Factor 1 (QQE 1)
E) MOM – Momentum
Value:
10 Close
F) Daily Pivot points at start times
Values:
Pivot set 1 = Daily (1=daily, 2=weekly, 3=monthly)
G) Trading Hours
Values:
3AM EST to 3PM EST only

How to spot a trade opportunity:
Buy/Sell signals:
After you get the two signals (Arrow & QQE 60 cross signal) you enter after the QQE5 or QQE1 cross the 50 line.
Only take the short trade if the signal generates below the Daily Pivot level.
Only take the Long trade if the signal generates above the daily pivot level.

Exit:
If QQE5 cross to the opposite direction you must exit the trade.

Re-enter:
You can re-enter a trade when QQE1 touch the 50 line and cross back towards the QQE60. When you get the proper entry set up, check for the 1hr momentum. If the 1hr momentum and 15 min Momentum on the new confirmation bar shows a very promising trend continuation (45 Degrees plus bent) you don’t have to wait until the 5 SMA touches to enter.

When the momentum shows a sharp bent on any given TF, it indicates a retracement is due to 5sma of that particular TF. I'm always hesitant to introduce the Momentum indicator, since on a trending market if the momentum changes to the opposite direction some traders blow their account by trying to catch the retracement. When ever you catch a retracement you are going against the trend. You only suppose to use it to find better entries to go with the trend

Stop Loss:
60 pips
SL is closet support or resistance around 60pips

Take profit:
100 pips

Applying Daily Pivots & 100sma to minimize the fake calls.

Long-
15 QQE60 crossed above the Daily Pivot (15 Min Timeframe Only)
Price is above the 100 sma & LevelStop-Reverse
I also use 1hr QQE5 to identify the trend direction


Applying Daily Pivots & 100sma to minimize the fake calls.

Short-
15 QQE60 crossed down Below the Daily Pivot (15 Min Timeframe Only)
Price is below the 100 sma & LevelStop-Reverse

Share your opinion, can help everyone to understand the forex strategy.

Download
Secret Weapone
Secret_Weapon.zip
Compressed Archive in ZIP Format 109.4 KB