четверг, 5 июля 2018 г.

5 min Momo Trade Trading System

Submit by Joker (Written by  Kathy Lien and Boris Schlossberg)

What's a Momo?
The Five Minute Momo Trade looks for a momentum or "momo" burst on very shortterm
(five-minute) charts. First, traders lay on two indicators, the first of which is the
20-period exponential moving average (EMA). The EMA is chosen over the simple
moving average because it places higher weight on recent movements, which is needed
for fast momentum trades. The moving average is used to help determine the trend. The second indicator to use is the moving average convergence divergence (MACD)
histogram, which helps us gauge momentum. The settings for the MACD histogram is
the default, which is first EMA = 12, second EMA = 26, signal EMA = 9, all using the
close price.

This strategy waits for a reversal trade but only takes advantage of it when momentum
supports the reversal move enough to create a larger extension burst. The position is
exited in two separate segments; the first half helps us lock in gains and ensures that we
never turn a winner into a loser. The second half lets us attempt to catch what could
become a very large move with no risk because the stop has already been moved to
breakeven.
Rules for a Long Trade
1. Look for currency pair trading below the 20-period EMA and MACD to be
negative.


2. Wait for price to cross above the 20-period EMA, then make sure that MACD is
either in the process of crossing from negative to positive or has crossed into
positive territory no longer than five bars ago.
3. Go long 10 pips above the 20-period EMA.
4. For an aggressive trade, place a stop at the swing low on the five-minute chart. For
a conservative trade, place a stop 20 pips below the 20-period EMA.
3. Go short 10 pips below the 20-period EMA.
4. For an aggressive trade, place stop at the swing high on a five-minute chart. For a
conservative trade, place the stop 20 pips above 20-period EMA
5. Buy back half of the position at entry minus the amount risked and move the stop
on the second half to breakeven.
6. Trail stop by lower of breakeven or 20-period EMA plus 15 pips

5. Sell half of the position at entry plus the amount risked; move the stop on the
second half to breakeven.
6. Trail the stop by breakeven or the 20-period EMA minus 15 pips, whichever is
higher.
Rules for a Short Trade
1. Look for the currency pair to be trading above the 20-period EMA and MACD
to be positive.
2. Wait for the price to cross below the 20-period EMA; make sure that MACD is
either in the process of crossing from positive to negative or crossed into negative
territory no longer than five bars ago.

Our first example in Figure 1 is the EUR/USD on March 16, 2006, when we see the
price move above the 20-period EMA as the MACD histogram crosses above the zero
line. Although there were a few instances of the price attempting to move above the 20-
period EMA between 1:30 and 2:00 EST, a trade was not triggered at that time because
the MACD histogram was below the zero line.
We waited for the MACD histogram to cross the zero line and when it did, the trade
was triggered at 1.2044. We enter at 1.2046 + 10 pips = 1.2056 with a stop at 1.2046 -
20 pips = 1.2026. Our first target was 1.2056 + 30 pips = 1.2084. It was triggered
approximately two and a half hours later. We exit half of the position and trail the
remaining half by the 20-period EMA minus 15 pips. The second half is eventually
closed at 1.2157 at 21:35 EST for a total profit on the trade of 65.5 pips.
Our first example in Figure 1 is the EUR/USD on March 16, 2006, when we see the
price move above the 20-period EMA as the MACD histogram crosses above the zero
line. Although there were a few instances of the price attempting to move above the 20-
period EMA between 1:30 and 2:00 EST, a trade was not triggered at that time because
the MACD histogram was below the zero line.
We waited for the MACD histogram to cross the zero line and when it did, the trade
was triggered at 1.2044. We enter at 1.2046 + 10 pips = 1.2056 with a stop at 1.2046 -
20 pips = 1.2026. Our first target was 1.2056 + 30 pips = 1.2084. It was triggered
approximately two and a half hours later. We exit half of the position and trail the
remaining half by the 20-period EMA minus 15 pips. The second half is eventually
closed at 1.2157 at 21:35 EST for a total profit on the trade of 65.5 pips.
in Figure 1 is the EUR/USD on March 16, 2006
Figure 1
Figure 1


Figure 2
Figure 2
The next example, shown in Figure 2, is USD/JPY on March 21, 2006, when we see the
price move above the 20-period EMA. Like in the previous EUR/USD example, there
were also a few instances in which the price crossed above the 20-period EMA right
before our entry point, but we did not take the trade because the MACD histogram was
below the zero line.
The MACD turned first, so we waited for the price to cross the EMA by 10 pips and
when it did, we entered the trade at 116.67 (EMA was at 116.57).
The math is a bit more complicated on this one. The stop is at the 20-EMA minus 20
pips or 116.57 - 20 pips = 116.37. The first target is entry plus the amount risked, or
116.67 + (116.67-116.37) = 116.97. It gets triggered five minutes later. We exit half of
the position and trail the remaining half by the 20-period EMA minus 15 pips. The
second half is eventually closed at 117.07 at 18:00 EST for a total average profit on the
trade of 35 pips. Although the profit was not as attractive as the first trade, the chart
shows a clean and smooth move that indicates that price action conformed well to our
rules.


Short Trades
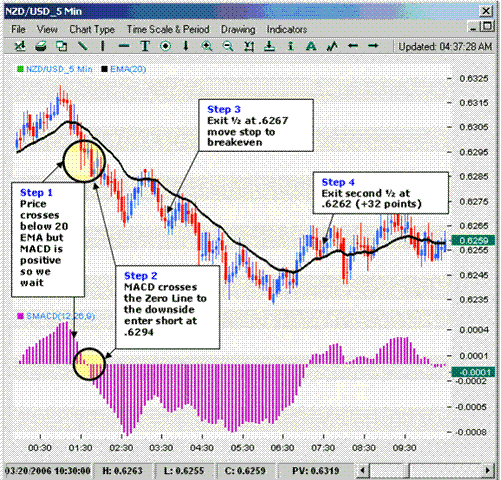
Figure 3
Figure 3

On the short side, our first example is the NZD/USD on March 20, 2006 (Figure 3).
We see the price cross below the 20-period EMA, but the MACD histogram is still
positive, so we wait for it to cross below the zero line 25 minutes later. Our trade is then
triggered at 0.6294. Like the earlier USD/JPY example, the math is a bit messy on this
one because the cross of the moving average did not occur at the same time as when
MACD moved below the zero line like it did in our first EUR/USD example. As a
result, we enter at 0.6294.
Our stop is the 20-EMA plus 20 pips. At the time, the 20-EMA was at 0.6301, so that
puts our entry at 0.6291 and our stop at 0.6301 + 20pips = 0.6321. Our first target is the
entry price minus the amount risked or 0.6291 - (0.6321-0.6291) = 0.6261. The target is
hit two hours later and the stop on the second half is moved to breakeven. We then
proceed to trail the second half of the position by the 20-period EMA plus 15 pips. The
second half is then closed at 0.6262 at 7:10 EST for a total profit on the trade of 29.5
pips.
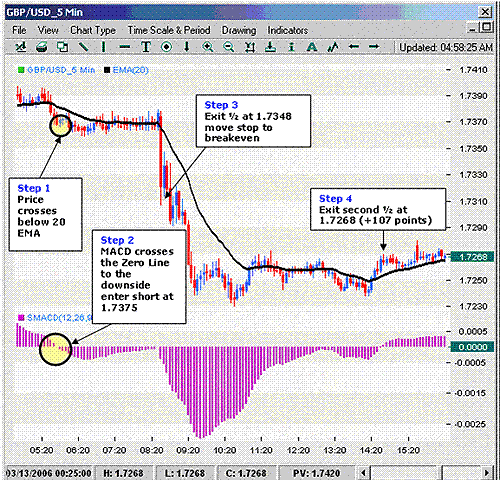

Figure 4
Figure 4
The example in Figure 4 is based on an opportunity that developed on March 10, 2006,
in the GBP/USD. In the chart below, the price crosses below the 20-period EMA and
we wait for 10 minutes for the MACD histogram to move into negative territory,
thereby triggering our entry order at 1.7375. Based on the rules above, as soon as the
trade is triggered, we put our stop at the 20-EMA plus 20 pips or 1.7385 + 20 = 1.7405.
Our first target is the entry price minus the amount risked, or 1.7375 - (1.7405 -
1.7375) = 1.7345. It gets triggered shortly thereafter. We then proceed to trail the second
half of the position by the 20-period EMA plus 15 pips. The second half of the position
is eventually closed at 1.7268 at 14:35 EST for a total profit on the trade of 68.5 pips.
Coincidently enough, the trade was also closed at the exact moment when the MACD
histogram flipped into positive territory.

Momo Trade Failure
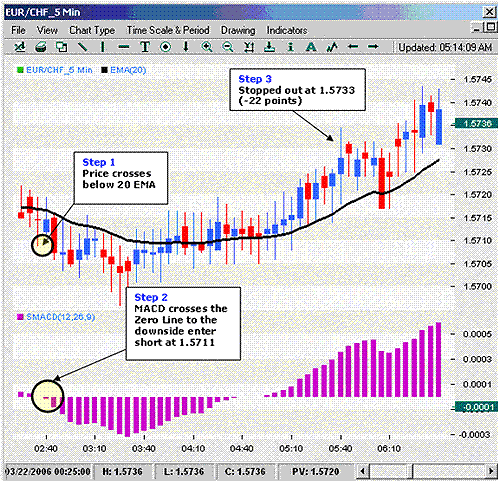
Figure 5
Figure 5
As you can see, the Five Minute Momo Trade is an extremely powerful strategy to
capture momentum-based reversal moves. However, it does not always work and it is
important to explore an example of where it fails and to understand why this happenThe final example of the Five Minute Momo Trade is EUR/CHF on March 21, 2006.
In Figure 5, the price crosses below the 20-period EMA and we wait for 20 minutes for
the MACD histogram to move into negative territory, putting our entry order at 1.5711.
We place our stop at the 20-EMA plus 20 pips or 1.5721 + 20 = 1.5741. Our first targetis the entry price minus the amount risked or 1.5711 - (1.5741-1.5711) = 1.5681. The
price trades down to a low of 1.5696, which is not low enough to reach our trigger. It
then proceeds to reverse course, eventually hitting our stop, causing a total trade loss of
30 pips.
When trading the Five Minute Momo strategy the most important thing to be wary of
is trading ranges that are too tight or too wide. In quiet trading hours where the price
simply fluctuates around the 20-EMA, the MACD histogram may flip back and forth
causing many false signals. Alternatively, if this strategy is implemented in a currency
paid with a trading range that is too wide, the stop might be hit before the target is
triggered.

 
 Conclusion
The Five-Minute Momo Trade allows traders to profit on short bursts of momentum,
while also providing the solid exit rules required to protect profits.

 
 Conclusion
The Five-Minute Momo Trade allows traders to profit on short bursts of momentum,
while also providing the solid exit rules required to protect profits.


Share your opinion, can help everyone to understand the forex strategy.

Bollinger Bands 5 min Scalping

Bolllinger Bands Scalping system

Submit By Janus Trader

Currency Pairs: EUR/USD, GBP/USD and GBP/JPY
Trading Sessions: EURO and US
Timeframe: 
5 Min
Indicators: Bollinger Bands (default settings)
Rules For Long Trades
1) Bollinger Bands must slope up.
2) Go long when the price touches the middle BB band from above.
3) Set stop loss at the lower band or max 15 pips (whatever comes first).
4) Take profit at the upper band.

Rules For Short Trades
1) Bollinger Bands must slope down.
2) Go short when the price touches the middle BB band from below.
3) Set stop loss at the upper band or max 15 pips (whatever comes first).
4) Take profit at the lower band.
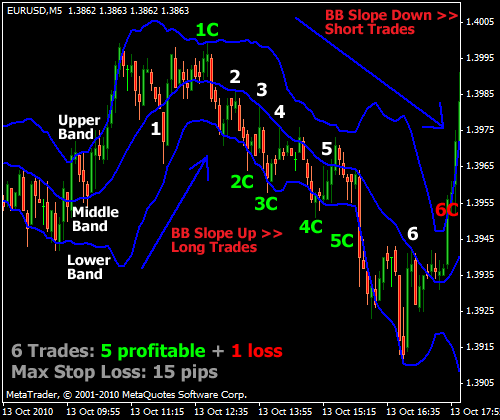
EURO/USD Trades Explained (see picture above)
Trade 1: Bands slope up >> long at 1.3981 (middle band).
Stop loss at the lower band or max 15 pips.
Closed at the upper band 1.3999 for 18 pips profit.

Trade 2: Bands slope down >> short at 1.3986 (middle band).
Stop loss at the lower band or max 15 pips.
Closed at the lower band 1.3971 for 15 pips profit.
Trade 3: Bands slope down >> short at 1.3982 (middle band).
Stop loss at the lower band or max 15 pips.
Closed at the lower band 1.3964 for 18 pips profit.

Trade 4: Bands slope down >> short at 1.3975 (middle band).
Stop loss at the lower band or max 15 pips.
Closed at the lower band 1.3958 for 17 pips profit.
Trade 5: Bands slope down >> short at 1.3965 (middle band).
Stop loss at the lower band or max 15 pips.
Closed at the lower band 1.3950 for 15 pips profit.
Trade 6: Bands slope down >> short at 1.3941 (middle band).
Stop loss at the lower band or max 15 pips.
Stopped out the at upper band 1.3950 for 9 pips loss.
Total Trading Results:
+74 pips in 6 hours of scalping the EUR/USD 5 min chart


Share your opinion, can help everyone to understand the forex strategy.

пятница, 29 июня 2018 г.

Free Style Trading System

Submit by Joker

TIME FRAMES
You can trade the Freestyle System on any time frame, but I recommend that to start with,
you choose short timeframes such as 5 minutes or 15 minutes. Freestyle is a trend following system, so lower time frames will cause more signals, but the moves will necessarily be smaller. I suggest that once you have your charts set up, you scroll back through time and see if you can spot the entry signals.

SELECTING CURRENCY PAIRS TO TRADE:
While the Freestyle System works for all currency pairs, I would also recommend limiting the number of pairs you are trading based on your ability to monitor the charts so you don’t miss any signals, and that you pay attention to spreads, particularly during volatile periods when many brokers increase spreads. The issue about spreads is less important when trading longer timeframes.
CHART SETUP
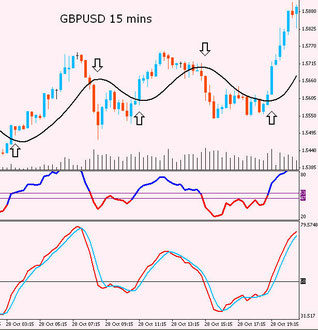
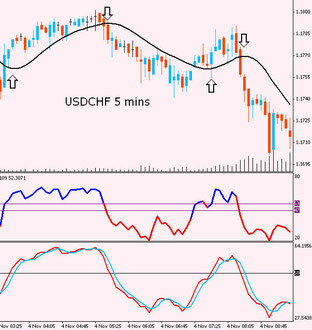
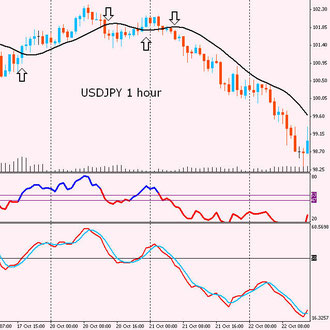
Using Freestyle is very simple. As you saw from the chart above, the screen shows the chart of the currency pair with a single thick black line running through it.

This is NOT a Moving Average, it is a line called the Laguerre Filter. In addition, in separate windows below the chart you will see the Color RSI indicator with two horizontal lines at 53 and 47. And below that is the QQEA indicator. I have adapted this indicator so that it simply shows one solid red line. On top of that line is a simple 3-period Moving Average in blue.
ENTRY RULES
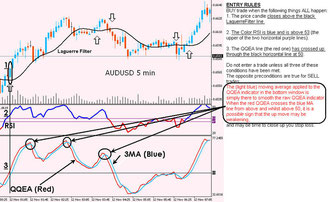
The entry rules are simple. You enter a BUY trade when the following things ALL happen:
1. The price candle closes above the black LaguerreFilter line.
2. The Color RSI is blue and is above 53 (the upper of the two horizontal purple lines).
3. The QQEA line (the red one) has crossed up through the black horizontal line at 50.
Do not enter a trade unless all three of these conditions have been met.


The opposite preconditions are true for SELL trades.
The (light blue) moving average applied to the QQEA indicator in the bottom window is simply there to smooth the raw QQEA indicator. When the red QQEA crosses the blue MA line from above and whilst above 50, it is a possible sign that the up move may be weakening, and may be time to close up you stop loss.
Download
Free Style Indicators
Free Style Trading System
freestyle_indicators.zip
Compressed Archive in ZIP Format 19.3 KB
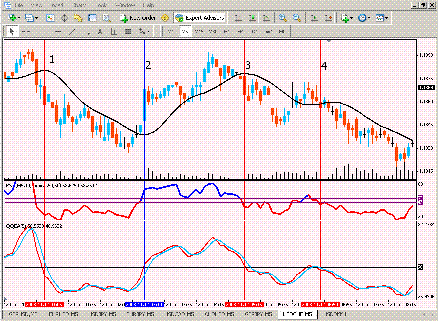
Above is a 5 min chart of USDCHF from November 12 2008. I have drawn 4 entry signals,
numbered 1 to 4, where the conditions of entry have been met.
Trade 1 is a sell.
Trade 2 is a buy.
Trade 3 is a sell.
Trade 4 is a sell.


EXIT RULES
I’m not going to get into the deep and detailed subject of trading psychology – there is tons of information and advice on that on the Internet. However, first, let’s understand about setting trading objectives. Forex trading is not a “get rich quick” activity. If you think it is, then you are probably in the wrong business. Wealth can be achieved by producing consistent returns over time and minimizing losses.
As I hope you have seen, the Freestyle system carefully selects entry points. How you decide to exit is a different matter, and will be affected by your attitude to risk and your goals.
If you trade short timeframes such as 5 minutes, then necessarily trades will be smaller as the waves are smaller, than if you trade longer timeframes. But there will be far more trades each day. How you decide to trade Freestyle will affect the way in which profitable pips are
accumulated – a higher number of small trades, or a smaller number of bigger trades.
If you observe, say, 6 pairs at a time at the 5 min timeframe, then you will likely see 4-5 trades per day per pair. That could mean 24-30 trades per day. If you took just 5 pips from each trade that would mean 120-150 pips per day or 600-750 pips per week. I am sure you do not need me to explain to you how performance like this will quickly accumulate with proper money management. What about 10 pips per trade?
Personally I would never open a trade without a Stop Loss, although I know traders who do. My reason is that if my connection fails or I have a power outage, I do not want to be left stranded, as it were. When trading at 5 minutes, I usually set a Stop Loss at around 40-60 pips away, depending on the pair I am trading, more if I am trading at 15 mins or 30 mins.
Once it comes to managing each trade, there are several exit strategies. I have characterized them as follows:
a. Scalping. You can use Freestyle as a “scalping” system, setting an immediate Take Profit
target of 5-10 pips.
b. Protective. Open a trade, wait for it to reach a preset target (say 15 pips) and move the
Stop Loss to a “protective” level just above your entry point, so whatever happens, the trade cannot lose. Then repeat at incremental levels until the trade is stopped out. For example, at +15 set SL to +2; at +25, set SL to +10; at +35, set SL to +20 and so on. Alternatively, this can be achieved by setting a Trailing Stop. In my experience, a Trailing Stop works better on
longer timeframes, as there is too much “noise” at shorter timeframes.
c. Laguerre. Exit when the price closes on the other side of the black Laguerre line. Quite often the price candle will penetrate the Laguerre line, but in order to exit, you should wait for the candle to close.
d. QQEA. You will recall from above that the QQEA line in the bottom window is the red line and is used as an entry signal. The light blue line is an overlaid simple 3-period moving average of the QQEA. Once in a trade (let’s say a but trade for example), when the re QQEA
line crosses down through the light blue simple MA line on the close of a bar, then that is a potential signal that the up trend may be weakening. You do not necessarily want to exit the trade at that point, because often the market will continue upwards after a pause. However, it may be prudent at that point to tighten your Stop Loss.
f. RSI. I know traders who, once in a trade, stay in that trade until the RSI line changes color, so if you are in a sell trade, you would stay in that trade until the RSI returned to a blue color.
Naturally, these exit strategies can be combined.

Download
free Style Templetes
freestyle_template.zip
Compressed Archive in ZIP Format 1007 Bytes

Share your opinion, can help everyone to understand the forex strategy.