пятница, 20 апреля 2018 г.

Extreme scalping modified Trading System

DSS Bressert Indicator

Submit By Max
Pairs:Major
Time frame: 1M, 5M.
Spread max:0,00025.
Price: Bar Chart

Metatrader 4 Indicators:
  1. DSS Bressert Indicator (8, 13);
  2. Carmens eyes;
4) LSMA (68)
Long Entry Position:
PA above Gann, M5 and M1 Carmens Eyes and LSMA 68,
  • DSS Bressert changes its color below 20.
Short Entry Position:
PA below Gann, M5 and M1 Carmens Eyes and LSMA 68,
  • DSS Bressert Indicator changes its color above 80.

No Trade Zone:
PA is between M5 and M1 Carmens Eyes.

TP / SL:
Change of DSS Bressert Indicator color or Gann Hi-Low.


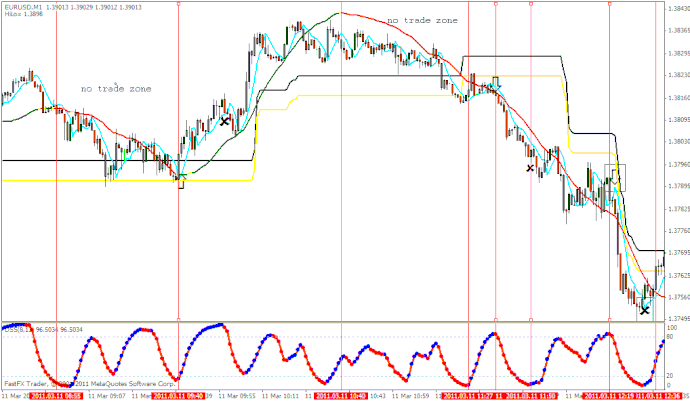
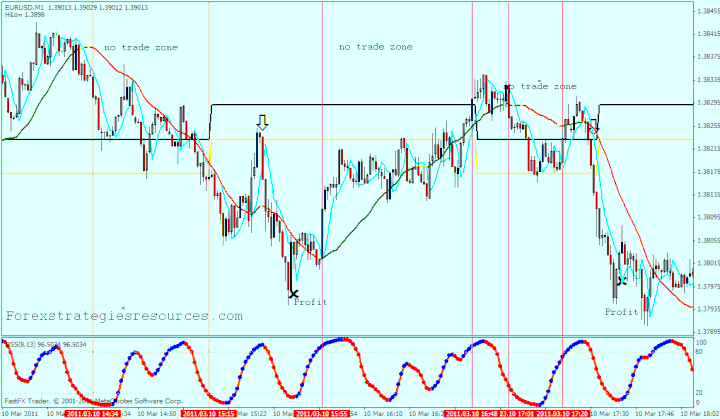
In the pictures below an example of the M1 Extrem Scalping Forex System in action.
Extreme scalping modified

Share your opinion, can help everyone to understand the forex strategy.

SD Trading System

Hama indicator

Submit by Zeno


SD Trading system is a strategy trend following based on Hama indicator.

Pairs:Majors
Time frame: 5M.
Spread max:0,00025.
Price: Bar Chart.


Indicators:
  1. SD Alarm

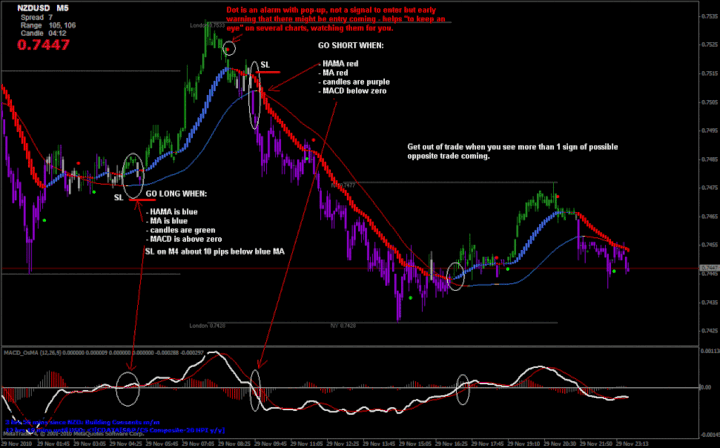
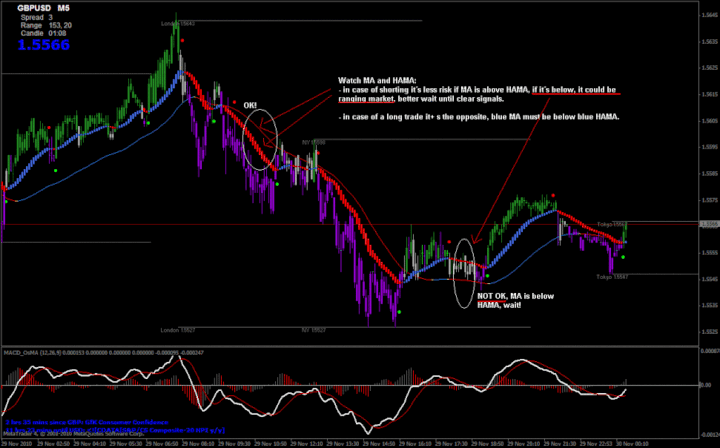
Enter Long Position: Hama candles are blue, candles are green, Macd is above zero and
Hama >MA.
Enter Short Position: Hama candles is red, candles are red, Macd is belove zero and Hama<Mare


Profit Exit: 15 pips or when the price touches Daily Fibo.
Stop Loss: about 10 pips belove or above MA.


In the pictures below an example SD Forex System in action.
SD Trading System
SD Trading System
SD Trading System
SD Trading System

Share your opinion, can help everyone to understand the forex strategy.

Bollinger Band scalp GBP/JPY Trading System

Scalp GBP/JPY

Pairs:GBP/JPY
Time frame: 1M., 5M.
Spread max:0,0002 (
This Trading System is only for ECN Brokers Accounts);
Price: Bar Chart.

Indicators:
1) Bollinger Bands (50) deviation 2 color red;
2) Bollinger Bands (50) deviation 3 color orange;
3)Bollinger Bands  (50) deviation 4 color yellow.


Time based:Try and figure out how long will it take the market to get in your expected direction, if the time that you planned is already due, then close the order. No point on waiting for a loss..

Stop Loss: Since you are trading a very tight time frame your stops should also very very tight. Sometimes, you will profit from a 3 minute trade and you wont be able to set a proper S/L. So your stops will be given to you by your money management system.
Pairs:GBP/JPY
Time frame: 1M., 5M.
Spread max:0,0002 (ECN Account);
Price: Bar Chart.

Indicators:
1) Bollinger Band (50) deviation 2 color red;
2) Bollinger Band (50) deviation 3 color orange;
3)Bollinger Band (50) deviation 4 color yellow.

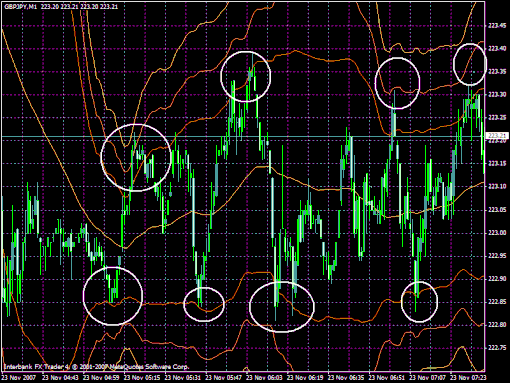
Short Entry position:When price crosses the upper red b at least half way to the orange b (if it gets to the yellow b is better but not as usual) Then the price will tend to retrace towards the center of the bollinger bs you profit form this retracing. 

Long Entry position:it is the same as selling, the difference is that we will wait for the price to range between the lower red and yellow bands, and trade the retracing towards the center.

Profit Exit: Go for 5 to 10 pips, or exit at middle band.

Stop Loss:To have two kinds of stops: time based and loss based.

In the picture below the examples of the entry points.
Share your opinion, can help everyone to understand the forex strategy.

Ema bands Trading System

Guppy Indicator


Submit by Marck
Trading system Ema bands is an trend following forex strategy based on the exponential moving average.
Pairs:Major
Time frame: 1M.
Spread max:0,00015.
Price: Bar Chart.

Guppy Indicator:
Ema 2-3-4-5-6-7-8-9-10-11-12-13-14-15 yellow color;
Ema 17-19-21-23-25-27-29-31-33-35-37-39-41 sky blu;
Ema 44-47-50-53-56-59-62-65-68-71-74 green color.
Long or Short entry position:when the Group of Ema`s Yellow crosses the group of Ema's Green.

Re-entry:when the price touches the group Ema's green or blue and returns to the group of ema's yellow.

Profit exit:7 Pips when the group Ema' s yellow, breaks group Ema's Green, 4 pips in pull back.

Stop Loss: 5 pips.


Share your opinion, can help everyone to understand the forex strategy.
Volatility Scalp Trading System

Volatility Damiani Noise

Submit by  ForexStrategiesresources

This Trading System is only for ECN Brokers Accounts
 Pairs:EUR/USD
Time frame: 1M.
Spread max:0,0001.
Price: Bar Chart.
Indicators:
ADX (DMI);
Momentum (14).
T Stop;
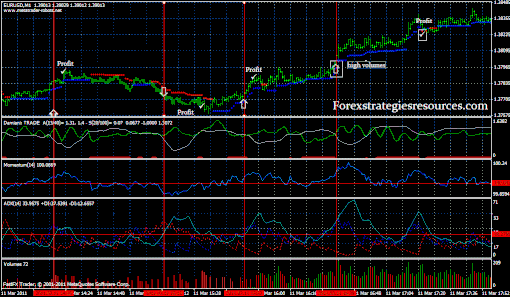
Long Entry position:
ADX(14) >28;
Momentum (14)> middle line;
Damiani noise is reporting good volatility;

Short entry position:
ADX(14) >28;
Momentum (14)< middle line;
Damiani noise is reporting good volatility.


Profit exit: target price is 5 pips no more, but if there is highvolatility and volumes follow the position with T Stop

Share your opinion, can help everyone to understand the forex strategy.
Scalping with Parabolic SAR and Fibonacci

Fibnacci Retracement

Submit by  ForexStrategiesResources

Apply 2 Parabolic SAR to a 1 min EUR/USD chart.
1st ones settings = 0.02 & 0.2
2nd ones settings = 0.005 & 0.05
I only trade EUR/USD since I get a 1.5 pip spread at .
I only trade from 4amEST-6amEST.
I only trade in the direction of the 0.005 & 0.05 PSAR.

LONG
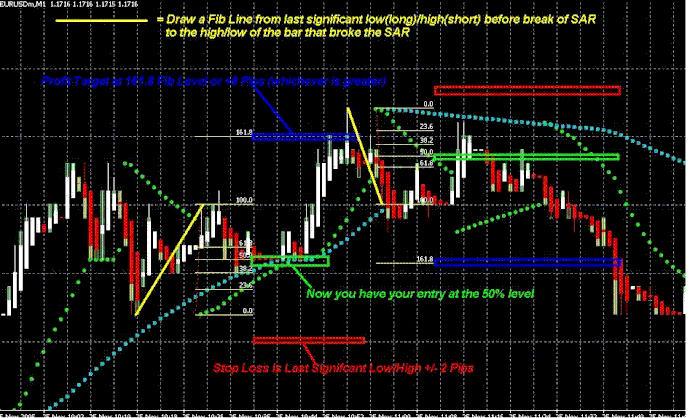
When price breaks up through the 0.02 & 0.2 PSAR you draw a Fibonacci retracement
from the closest last significant low (before pirce broke PSAR)
to the high of the bar that broke the PSAR.
This gives you your PROFIT TARGET at 161.8% Level
and your ENTRY ar 50% level
STOP = Last Signifcant low -2 Pips
SHORT
When price breaks down through the 0.02 & 0.2 PSAR you draw a Fibonacci retracement
from the closest last significant high (before pirce broke PSAR)
to the low of the bar that broke the PSAR.
This gives you your PROFIT TARGET at 161.8% Level
and your ENTRY ar 50% level
STOP = Last Signifcant high +2 Pips

Scalping with Parabolic SAR and Fibonacci
SIMPLE MM VARIATION.
LONG
When price breaks up through the 0.02 & 0.2 PSAR you draw a Fibonacci retracement
from the last significant low (before pirce broke PSAR)
to the high of the bar that broke the PSAR.
This gives you your ENTRY @ 50%.
PROFIT TARGET = +9 Pips
STOP = -8 Pips
SHORT
When price breaks down through the 0.02 & 0.2 PSAR you draw a Fibonacci retracement
from the last significant high (before pirce broke PSAR)
to the low of the bar that broke the PSAR.
This gives you your ENTRY @ 50%.
PROFIT TARGET = +9 Pips
STOP = -8 Pips


Share your opinion, can help everyone to understand the forex strategy.