вторник, 21 февраля 2017 г.

Ross Hook Show 123

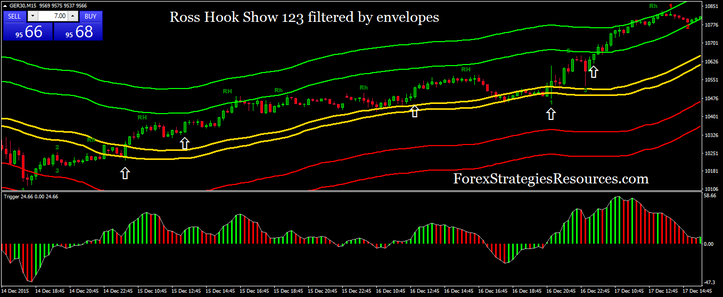
Ross Hook Show 123 filtered by envelopes

Submit by Xavier Trader 21/02/2017

Ross Hook Show 123 filtered by envelopes It is a way to interpret the hook very simple and has the advantage of entering the market only in the direction of the trend.
The envelopes are build with Ema 34 low and high.
This strategy is setting only for 5 minutes and 15 minutes.

Financial markets:any.


Metarader Indicators for this template.
Ross Hook Show 123, (this indicator sucks much ram your computer).
Exponential moving average 34, close, low with levels -150 and -250
Exponential moving average 34, close, low with levels 150 and 250.
Trigger indicator

Trading Rules Ross Hook Show 123 filtered by envelopes
Trading only in the direction of the trend.
The trend is up above the 34 Ema high,
the trend is down below the 34 Ema low.

Buy
Price above 34 Ema high.
The price breaks upward the level price of the green number 2 or RH .
Trigger above zero level.

Sell
Price below 34 Ema low.
The price breaks downward the level price of the green number 2 or RH.
Trigger below zero level.

Exit position
When the price is into the envelopes you can use the levels as profit target and stop loss.
When the price is outside the envelopes make profit with fast profit target and place stop loss below/above the lower/higher envelope.


Apply
 this template only in currencies trending.
Never in markets side.


In the pictures Ross Hook Show 123 in action.
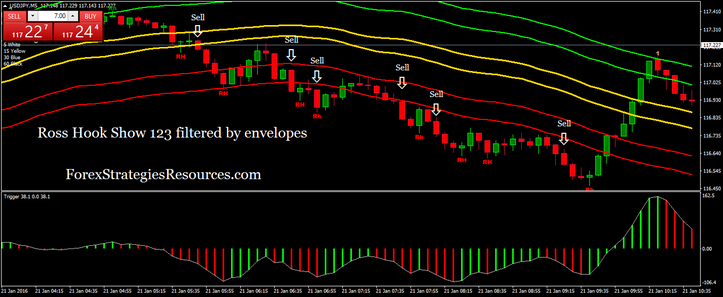
Ross Hook Show 123 filtered by envelopes
Download
Ross Hook show V.2 123.zip
Compressed Archive in ZIP Format 15.3 KB

ITM X-Gen Daily Scalper Indicator

1 minute scalping

Submit by Leonida 21/02/2017

ITM X-Gen Daily Scalper is a indicator professional for trading only at 1 min time frame. This indicator is suitable for scalping or binary options high / low. The indicator indicates the direction of the trend and the moments to buy or sell.

Indicator produced by the ITM Financial 2012


Time frame 1 min
Financial markets: any with low spreads.
Binary options high/low expiry time 6-10 candles.

You can use this indicator following the directions given.
Or by defining with other indicators the trend and using only the arrows.

Simple trading rules ITM-X-GEN Daily Scalper indicator
Trading in the direction of the trend.
Buy
Trend long and buy arrows

Sell
Trend short and Sell arrows.

Place initial stop loss 6 pips below/abow the bands.
Profit Target predetermined or based by the volatility of the momentum.


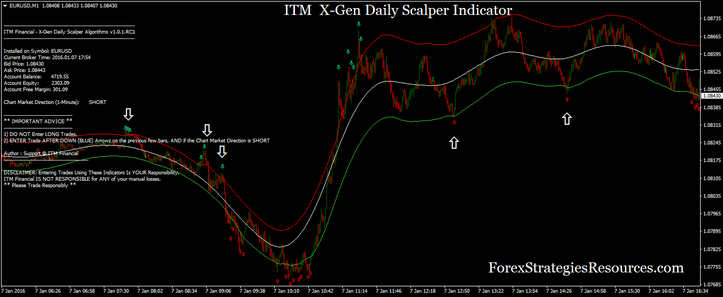
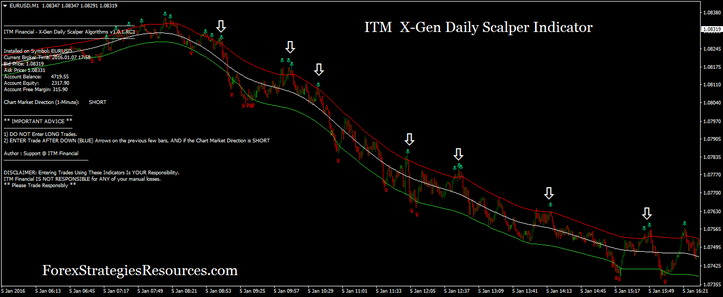
In the pictures ITM X-Gen Daily Scalper Indicator in action.
ITM  X-Gen Daily Scalper Indicator
ITM X-Gen Daily Scalper Indicator
ITM  X-Gen Daily Scalper Indicator
ITM X-Gen Daily Scalper Indicator
Download
ITM X-Gen Daily Scalper Indicator.zip
Compressed Archive in ZIP Format 30.4 KB

Smart Money Index Trading

Smart Index Trading

Submit by Orazio 21/02/2017
Smart Money Index Trading is an intraday trading system trend-momentum based on the Smart Money Index Indicator and two entry arrow indicators.
Time frame 5 min or 15 min.

Currency pairs:any.


Metatrader Indicators:
Dynamic bull and bear band (Band 1: Dev 2, Band 2, Dev , Band 3: Dev 4)
Gann Support and resistance,
Swing Trader arrow,
Smart Money Index,
Hypertrend indicator,

Trading rules Smart money index trading.
In this strategy there are two differents arrow: Swing arrow and Hipertrend arrow.

First approach
Trading only in direction of the Smart Money Index.

Buy
Hypertrend buy arrow confirmed by Smart Money Index with green bar.
Swing Trader arrow buy confirmed by Smart Money Index with green bar.

Sell
Hypertrend buy arrow confirmed by Smart Money Index with red bar.
Swing Trader arrow buy confirmed by Smart Money Index with red bar.

Second approach

Buy
When the price go in lower bands zone wait the buy arrow.

Sell
When the price go in upper band zone wait the sell arrow.

Do not open more than one position in the same direction

Exit place 10-15 pips of stop below/above the entry bar.

Make profit with profit target predetermined at the opposite arrow.


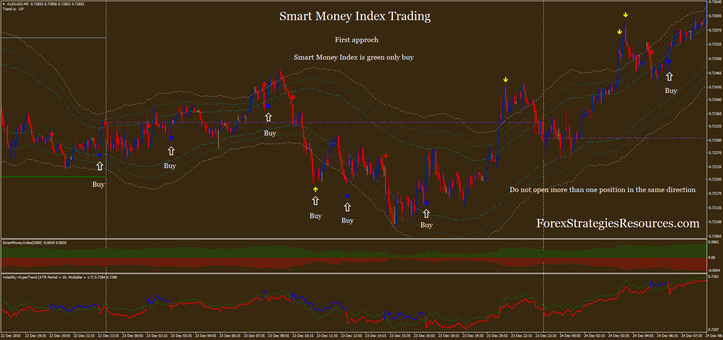
In the pictures Smart Money Index Trading in action.
 Smart Money Index Trading
Smart Money Index Trading
 Smart Money Index Trading
Smart Money Index Trading
Download
Smart Money Index
Smart Money Index trading.rar
compressed file archive 46.0 KB

Dynamic Intraday Trading

Dynamic Zone Spearman 

Submit Lucensko 21/02/2015

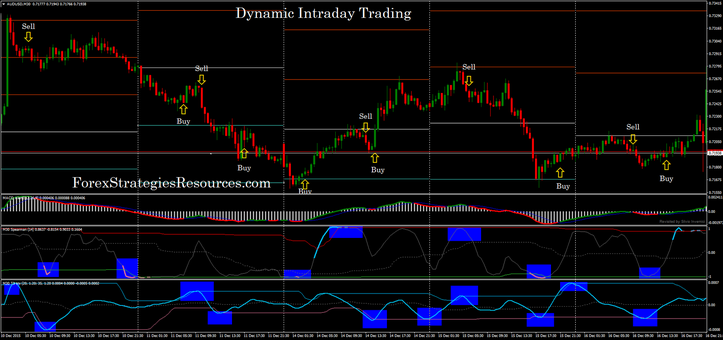
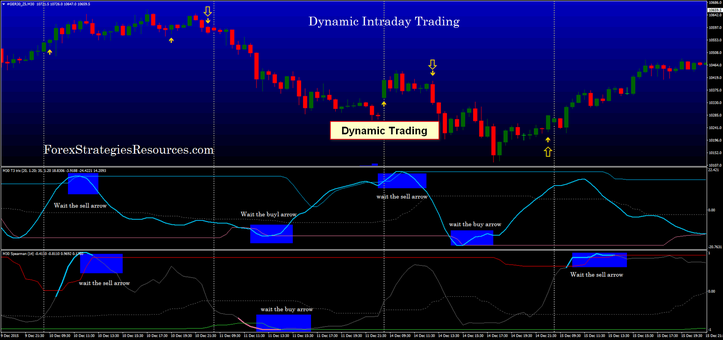
Dynamic Intraday Trading is a great method based on overbought and oversold zone of dynamics indicators as Dynamic Zone T3 and Dynamic Zone Spearman.
For intaday trading the best time frame is 30 min.
Financial Markets any.

You can apply this method also for trading with binary options high/low (expiry time 4-6 candles).


Metatrader indicators:
Dynamic Zone T3 Trix,
Dynamic Zone Spearman,
MACD alert or your favourite trend arrow indicator).

If you want to simplify the system you can use only one of the two dynamic indicators in the windows below. Here we use these two indicators to have a more speculative trading.

Trading rules Dynamic Intraday Trading

Buy
When the price is below the lower band of one of the two dynamic indicators and after, come back into the channel, wait the first signal buy (or with MACD alert or with a buy arrow).

Sell
When the price is above the upper band of one of the two dynamic indicators and after, come back into the channel, wait the first signal sell (or with MACD alert or with a sell arrow).

Exit position is discretionary becouse depends by also on the type of indicator that is used to enter.
When you reach a level pivot is recommended to close the profit.
Put the initial stop loss he previous swing high / low.


In the pictures the Dynamic Intraday Trading in action.

Dynamic Intraday Trading


Dynamic Intraday Trading

Download
dynamic intraday trading.rar
compressed file archive 178.8 KB

MA Histogram Scalping

MA with bands scalping

Submit by Dave (written by Ben Agham) 21/02/2017

Ma histogram scalping is an intraday system trend-momentum based on moving average and Bressert Stochastic oscillator. The but of this system is find the best trades with less loss. This system is able to identify good trading opportunities.

This system is designed for the intraday trading but can also be used in swing with appropriate settings. In addition to time frames of 5 min or 15 min it can be used for trading binary options high / low (expiry time 4-6 candles).


Metatrader Indicators:
Any candle,
Targgets Bands,
DSS bressert stocastic oscillator (8, 13),
MA Histogram ( 5, 100).

Trading rules MA Histogram Scalping
Buy
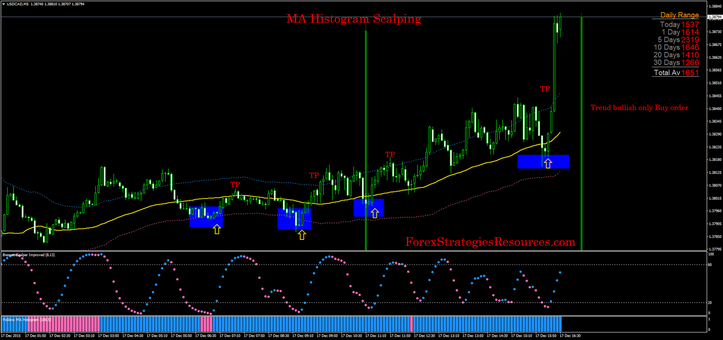
1. Trend of the day is bullish (daily candle color green);
2. MA Histogram (100, 5) is color blue;
3. Price is above middle band or upper band;
4. DSS Bressert stochastic the dots went below 20 level and color turns blue;
5. Buy order when DSS Stochastic becomes BLUE and bar is closed.

Sell
1. Trend of the day is bearish (daily candle color green);
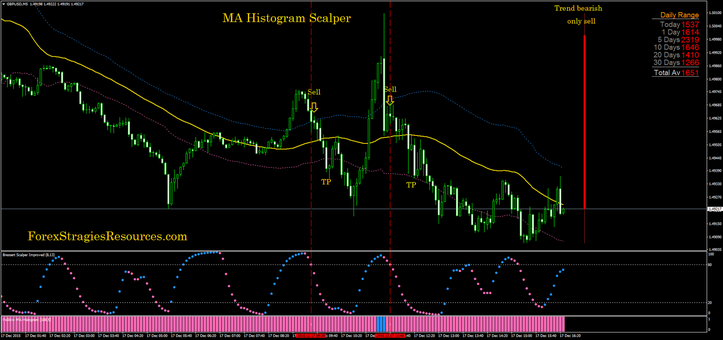
2. MA Histogram (100, 5) is color red;
3. Price is below middle band or lower band;
4. DSS Bressert stochastic the dots went above 20 level and color turns red;
5. sell order when DSS Stochastic becomes red and bar is closed.

Exit position
Place initial stop lolss on the previous swing high/low.

Make profit at the middle band or opposite band or with predetermine profit target that depends by time frame and currency pairs.


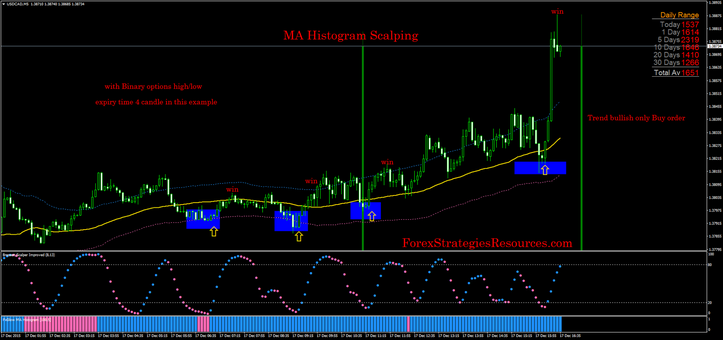
In the pictures MA Histogram Scalping in action.
MA Histogram Scalping
MA Histogram Scalping with binary options high/low
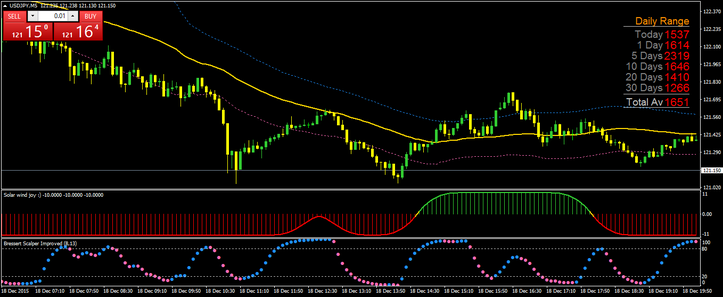
MA histogram replaced by solar wind joy indicator (50 period, smooth 10).
Trading with the same rules.

Solarwind Joy is a repaint indicator (but this setting is very slow).
SolarWind joy
SolarWind joy
Download
Solar_Winds_joy_-_histo_uno_repaint_with
Compressed Archive in ZIP Format 1.7 KB
Download
ma histogram scalper.rar
compressed file archive 82.0 KB