среда, 12 сентября 2018 г.

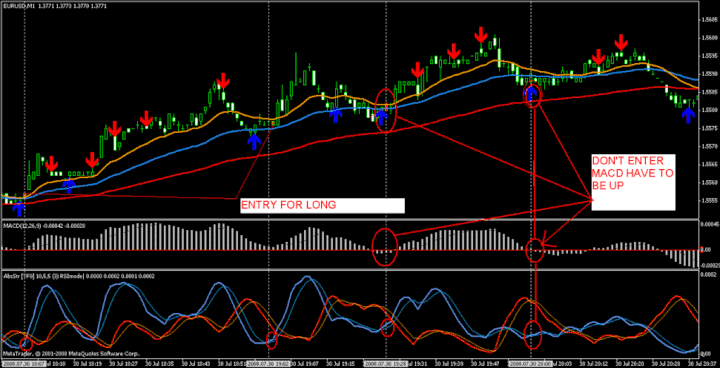
Trading System, Absolute Strenght Scalping

Time Frame 1 min.
Currency pairs: majors.

Indicators:
Absolute Strenght,
MACD (default)


Rules:
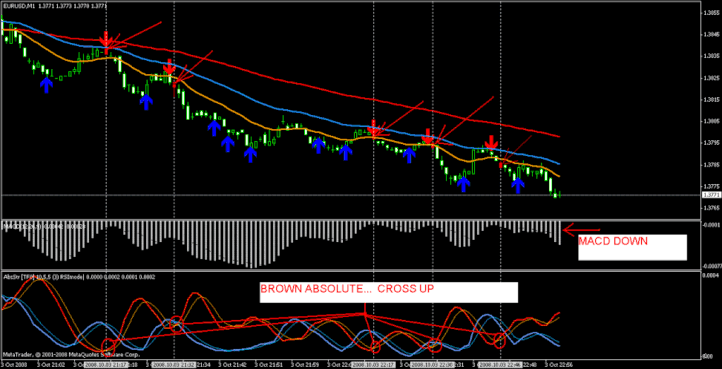
Entry Short:
1. MA 9 below the MA 21 and both of them has to be below MA 50
2. MACD down
3. After Stochastic cross Arrow ( down ) the brown Absolute.... indicator has to cross up.
EntryLong:
1. MA 9 above the MA 21 and both of them has to be above MA 50
2. MACD up
3. After Stochastic cross Arrow ( up ) the blue Absolute.... indicator has to cross up.
10 pip Target Profit and the Stop Loss 5 pips below the entry candle.


In the pictures Absolute Strength Scalping in action.
Download
AbsoluteStrength_v1.1_mtf
AbsoluteStrength_v1.1_mtf.rar
compressed file archive 2.2 KB
Download
Stochastic_Cross_Alert
_Stochastic_Cross_Alert_SigOverlayM_cw.r
compressed file archive 1.6 KB
Download
Templete absolute strength Trading System
Templete absolute strngth.rar
compressed file archive 1.1 KB

Share your opinion, can help everyone to understand the forex strategy.

Fibonacci Scalping

Every trader should know how to plot the Fibonacci retracement and projection with ease. However, not everyone who knows how to calculate the Fibonacci levels knows how to trade under real market condition.

To trade the Fibonacci retracements and projections effectively, a trader must also understand the price action of the forex market. And using candlestick formation is one of the most effective ways to determine the immediate market sentiment.

A hanging man formation during a downtrend shows that the bears are losing strength and the trend is about to reverse. At the same time, we must also acknowledge that there are alsoFibonacci levels to concern about. The best scenario of a rejection at the Fibonacci level is when a candlestick showing a hanging man formation closes above the 38.2% level of aFibonacci retracement.
This setup proves that the uptrend is strong and the retracement is merely profit taking. The rejection at 38.2% level also reveals that more bulls are waiting at the sideline to enter the market at a more favorable market price.
Fibonacci Trading - Scalping Technique


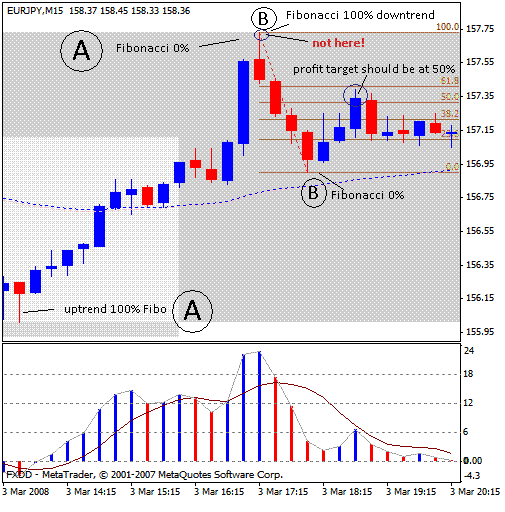
Fibonacci trading can be used on any time frames, even as a scalping technique on a 5-minute chart and it can be quite profitable if you know how to do it in Forex trading. Let’s look at an example at the simple illustration below; assuming that the currency pair is on an uptrend movement and the price presumably has hit a top and then reversed. We would then draw the Fibonacci retracement on the uptrend shown in Point A. The priceaction then retraced to near 50% and encountered good support at that price.

In the picture Fibonacci Scalping in action.
How to enter a position

On a 
5-minute chart, you should be able to tell that the candlestick formation would give you an immediate sign of a possible bounce. On the next candlestick after the low near the 50% retracement of Point A, open long if it closes higher low than the previous candlestick. Since this is a scalping method, your first profit should be the 50% retracement resistance level (Point BFibonacci retracement) from the original Point A 0% retracement to 50% where your position is entered. You would probably think that the profit target from the point of entry should be the original 0% retracement but that is not usually true. As in any market conditions; we are not be able to tell where the price is going next. Remember that this is a scalping technique which should help you to reap about 15 to 20 pips depending on the range of the Fibonacci retracement is drawn. This is useful if you have a tight stop and prefer not to hold position for more than a hour. You should be able to see consistent good results using this simple technique.
Sensitive Fibonacci Retracement Levels

Using a retracement calculation, you should try to identify the 38.2%, 50% and 61.8% of the Fibonacci retracements. If an uptrend is strong, the price action will most likely to see strong support at 38.2%, while at 50% would see bears pushing hard to open the gate. 61.8% should then be seen as the bulls are retreating to heal their wounds with the momentum temporarily shift with the bears.


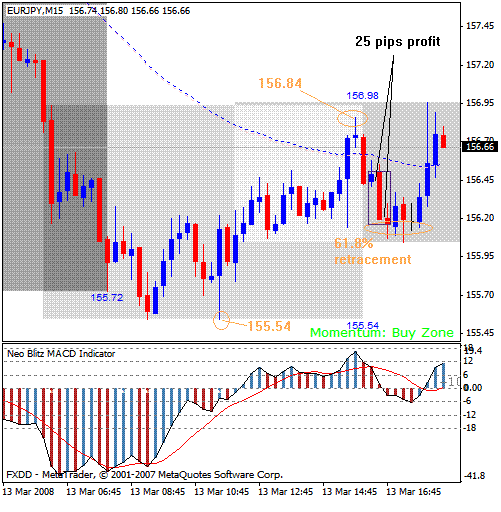
The Asian session saw a big fall on Euro against the Yen on Thursday. Technically, it was very obvious on the chart and I did a short trade on the currency pair. I had mentioned Fibonacci trading last Friday as one of the methods I used. I will show you how I did it with this short trade. During the early US session on Thursday morning Eastern Time, you should see that the price moved upwards to 156.84 before a bearish 15-minute candle started the downtrend. Keeping in mind that the low was 155.54 and then the recent top was at 156.84, we calculated that the retracement should see some support at 156.04 area (see the attached calculation on the right below).

I entered this short trade because I got a signal from my setup and it was aligned with the main day movement (downtrend). I then entered the price at 155.45 with stop-loss at 20 pips away. I set my profit target using my own calculated price 156.20 near the 61.8% retracement area. About 25 minutes later, the short position was done with a 25-pip gain. Why I entered at 156.45 was because on the 5-minute chart, there was a rejection at 156.58 which is the Fibonacci 38.2% level (155.84 to 155.42), therefore I entered at that price (also see the right calculation on the picture above). 


Share your opinion, can help everyone to understand the forex strategy.
FX Prime Trading System

This is a momentum forex system based on the indicators. 
Time Frame 1min
Currency Pairs: majors

Long Trade
CCI 170 Over the 0 Line showing uptrend MUST BE THE FIRST TO CROSSCCI 34 Over 0 line as well showing uptrend MUST BE SECOND TO CROSS IN SAME DIRECTIONRSI over 55 <------ VERY IMPORTANT dont enter if its in between the 45-55 zone (45-55) IS DANGER DO NOT ENTER ZONE once it crosses in the same direction take the trade.
Short Trade
CCI 170 under 0 line showing down trend MUST CROSS FIRST
CCI 34 under 0 line showing down trend MUST CROSS SECOND
RSI under 45 same as above dont trade when in the 45-55 zone.
 

Example Trades

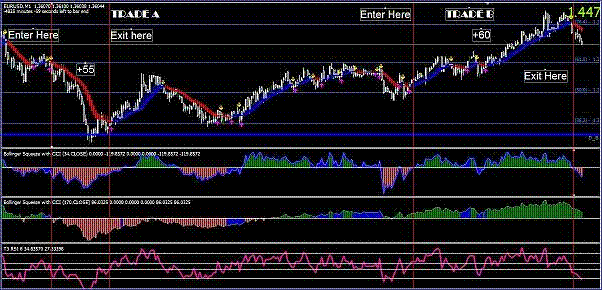
TRADE A (Short)


On trade A we see both the cci's are under 0 we also see that the Heiken Ashichanges color and we see that that line now becomes resistance also RSI is under the 45 we take the trade and exit when Heiken Ashi turns blue or CCI 34 is showing weakness and crosses back under the 0 line.

Trade B (Long)

Again another wonderful trade as we see its hitting the resistance line and is ready to go up. You see both CCIs are over 0 and rsi is over 55. We exit when ccigoes back under 0.
*** On the above chart there is one more signal that could of been traded after reading the rules try fo find it!!!*** would of given you another 15-20 pips! **

In the pictures FX Prime trading system in action.

Share your opinion, can help everyone to understand the forex strategy.

CCI Forex Strategies

Download
FX Prime Trading System
fx prime.rar
compressed file archive 17.0 KB

Forex Forecast Trading System

The scalping system we are about to show you is very flexible, it can be traded on any time frame from 1 Minute to 1 Day. My personal favorites are 5 Minute and 1 Hour charts as they seem to provide the best setups, I scalping the 5 Minutes charts and Plan longer term trades on the 1 Hour charts throughout the week.
Time Frame 5 min.
Indicators: GMMA and Stochastic (9,3,3,).


The system will work on any pairs at all but I suggest scalping the pairs with the lowest spread and mainly sticking to the major pairs for trading the longer term time frames.
On your chart you will see 5 orange lines and 2
pink lines, these lines are for gauging the trend. Below are 2 examples of a normal trend up and one of no trend at all.
When the pink lines cross the orange lines and they widen we have a trend in progress, the wider the lines the stronger the trend.
When the orange lines are close together and the pink lines are going from one side to the other  there is no trend direction.
When a pullback is occurring the 2 pink lines often move closer together but do not cross the orange lines.
The Indicator that is at the bottom of the chart is
the stochastic indicator set to 9,3,3, this shows us with reliable accuracy when price is over sold or over bought. At the top of the indicator is an 80 line and at the bottom is a 20 line.
This indicator is out trigger for the trade!
In a downtrend as price makes a pullback to the orange Gamma lines and the pink lines come closer together we watch the blue line of the stochastic indicator for it to go over the 80 line and then back again, as soon as it crosses back over the 80 line we take a short trade.


In a sell position it is the opposite, once price
is in an uptrend we look for a pull back to the
pink lines and wait for stochastic to cross the 20 line and cross it back again to enter a buy position. See examples and more see pdf in attach


Share your opinion, can help everyone to understand the forex strategy.
Download
Forex Forecast
Manual and Templete
Forex Forecast.rar
compressed file archive 2.0 MB

True Point Trading System

Trend Color

True Point Trend Color


Submit by Janus Trader
In your download ForexSingal folder, Copy and Paste this 2 file into the indicator folder: True_point_signal.mp4 Trend_color_signal.mp4 .
Locate Metatrader4 indicator folder and save it to the ’indicators’ folder inside the 
experts’ folder of your MetaTrader4’s installation folder:( most computer you can find the folder in: C:Programfiles\Metatrader4\experts\indicators)
2. After you get the .mp4 file in your indicators folder through download, you can start using it with your MetaTrader 4 platform.
Time Frame 5min
Currency pairs: EUR/USD, GBP/USD, AUD/USD,
True point (Entry and exit indicator),


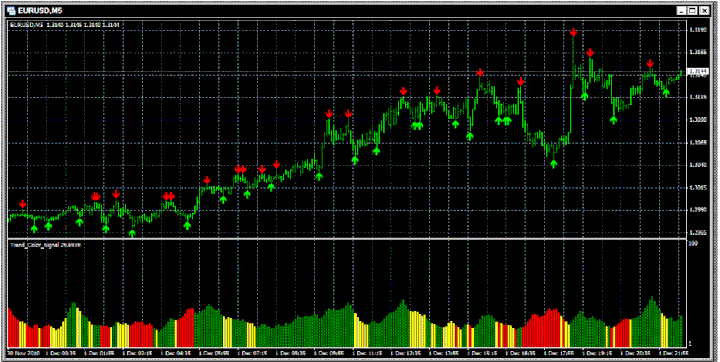
Rules
Buy
Green arrow and green bar of the trend color signal.
Sell
Red arrow and red bar of the trend color signal.

Exit position at opposite arrow or fast exit with profit target predetermined.


In the pictures True Point trading system in action.

Share your opinion, can help everyone to understand the forex strategy.
Download
True Point
forexsignal.zip
Compressed Archive in ZIP Format 873.3 KB
Download
True Point
INSTRUCTION.pdf
Adobe Acrobat Document 421.5 KB