среда, 12 сентября 2018 г.

100 pips Trading System

Time Frames and Pairs
1 min5 min
- All major pairs
(Works fine on EUR/USD 1 minute timeframe)


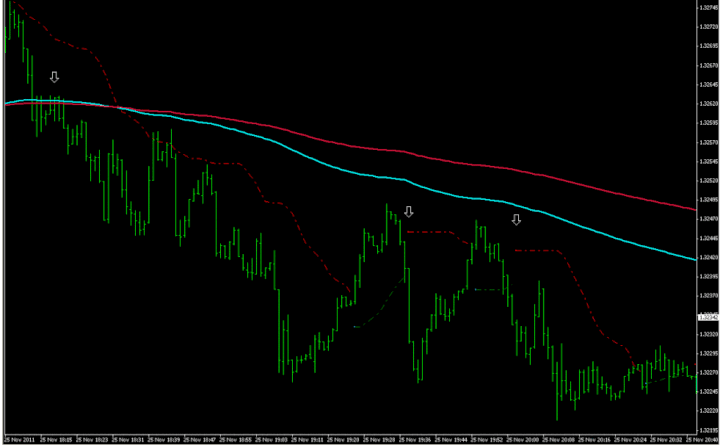
Long trades occur when the 100 Pips changes color from Red to Blue and 200EMA>365EMA.


Short trades occur when the 100 changes color from Blue to red and 200EMA<365EMA.


Stop Loss


Option 1
Place your stop loss according to the popup alert number.
It is a previous bar high or low + extra number of pips.
Adjust the SL extra number of pips in the indicator INPUTS.
IMPORTANT: Set stop loss for all your trades and do not deviate from it.
Once the trade has touched your stop loss be disciplined and close the trade.
Exiting Trades
Exit trades when the 100 Pips Daily Scalper issues the opposite trading signal.
This ensures that you trade with maximum profits and right before the market
reverses.
Another exit mechanism which is highly effective is to exit near strong support
or resistance levels. It is a method that generates exits earlier, so you take
profits early.
Never use the indicator on a weak/slow market – outside
recommended trading hours ( London or US sessions ).
Scalping signals never work well on a weak market, this has been
proven many times…
example:
AGAIN: Never use the indicator on a weak/slow market – outside
recommended trading hours ( London or US sessions ).
Scalping never works on a weak market, this has been proven many times…
The London session is the largest market and opens at 8.00GMT or 3AM EST
and closes at 17.00 GMT or 12 PM EST. Trading is best between
7.00GMT and 10AM GMT.

22.00GMT or 5 PM EST. The best trades occur in the first 2-3 hours.
IMPORTANT: It is extremely important to trade only following a current
trend! It will cut ALL bad trades! Never place a trade against a trend.
Example: If the current trend is up and the indicator
shows “BUY” signal – place a trade.
If the current trend is up and the indicator
shows “SELL” signal – NO TRADE! Wait for the next “BUY” signal…
Stay away from using the signals and open trades on unclear trends or
sideways trends.


Share your opinion, can help everyone to understand the forex strategy.

Download
100 pips Trading System
100 pips.rar
compressed file archive 14.4 KB

1 min scalp with 200 EMA

This is a scalping system trend following based on the direction of the 200 EMA (exponential moving averages)
Time Frame 1 Min
Currency Pairs: Majors.

Metatrader Indicators:
4xFreewayTrendsignal.mq4,
4xFreewayZig.mq4,
Freeway Heiken.mq4,
highwayH1.mq4,

ENTRY RULES
The Short Trade
200 period exponential moving average is pointing DOWN the RED LINE,
The Alert window has told you to SELL,
NonLagMa is red,
ONLY SELL IN A DOWNTREND (Recommended)
The Long Trade
200 period exponential moving average is pointing UP the RED LINE,
The Alert window has told you to BUY,
NonLagMa is Green,
ONLY BUY IN A uptrend (Recommended)


The Exit Strategy
The 4x FreewayTrendsignal Indicator gives a signal in the opposite direction
A Yellow Arrow on a BUY Order
A Blue Arrow on a SELL Order
The ALERT Window gives a signal in the opposite direction.


In the pictures 1 min scalp with 200 ma in action.
Short Trades
Short Trades
Long Trades
Long Trades

Share your opinion, can help everyone to understand the forex strategy.


Download
Trading System Scalper 4 Free
Scalper 4 free.rar
compressed file archive 10.7 KB

воскресенье, 9 сентября 2018 г.

Master Probability with Gann HILO MTF

Time Frame 5 min or higher
Currency Pairs all.
Indicators:
Master Prob
MTF Gann HILO Setting for 5min: (5 period, 60 min TF).

Long Entry
The Master Probability number shows the overall probability of the direction of trend above MTFGann HILO. Therefore, when looking for a long entry we need to confirm that the master probability is at least greater than 20 and price above MTF Gann Hilo indicator.
A Small Square on the chart shows a sharp turning point, it indicates that the previous trend is exhausted and prices might go in the other direction. Once you have deployed the indicator you will wait until a new square appears. A green square indicates that the price is expected to move up.
EXIT
STOP LOSS
Set stop loss 10-20 Pips below the recent dip or trend box low and Set Stop loss below or 5 pips below MTF Gann HILO
TAKE PROFIT
Ratio 
1.5 - 2 Stop Loss. (if stop loss is 12 pips Target Profit is 18 0r 24 pips)
Exit also when Master Probability is equal to or less than 0.
SHORT ENTRY
Short entry rules are the opposite to long entry rules.
Master Probability numbers show the overall probability of the direction of trend. Therefore, when looking for short entry we need to confirm that the master probability should be less than -20 and price below MTF Gann Hilo indicator.
A small Square on the chart shows a sharp turning point, it indicates that the previous trend is exhausted and prices might go in the other direction. Once you have deployed the indicator you will wait until a new square appears. A Red square indicates that the price is expected to move down.

STOP LOSS
Set stop loss 10-20 Pips below the recent dip or trend box High and Set Stop loss above, or 5 pips above MTF Gann HILO.
TAKE PROFIT
Ratio 
1.5 - 2 Stop Loss. (if stop loss is 12 pips Target Profit is 18 0r 24 pips)
Exit also when Master Probability is equal to or less than 0.

Entry also on the Breaks MTF Gann HILO (up Buy) and (down Sell) if master probability is >25


In the pictures Master Probability forex system in action.

Share your opinion, can help everyone to understand the forex strategy.

Gann Forex Strategies

Download
Master Probability Trading System
Master Prob.rar
compressed file archive 53.3 KB

BS 10 pis a day Trading System

This is what Schlossberg describes as the trade setup:
• Drag a standard Bollinger Bands indi (look under Indicators in the Navigator
window).with a standard deviation of 2.
• Drag a second standard Bollinger Bands indi with a standard deviation of 1. Colour
this one differently, so the position of the middle lines of the resulting pattern are
always obvious. 

Use the 'Steve's Bollinger Bands' template to do the work for you –
this will also place the Candle Time indi on your chart.
Here is the trading system:
• We trade a spike out of the two extreme BB lines.
• At the start of each new candle:
◦ When the previous 2 candles closed above the top line and the market is
sufficiently far above the next low round number + 20(0) to allow the take profit
to hit, we should SELL.
◦ When the previous 2 candles closed below the bottom line and the market is
sufficiently far below the next high round number - 20(0) to allow the take profit
to hit, we should BUY.
• Stop loss = 10(0).
• Take profit = 7(0).

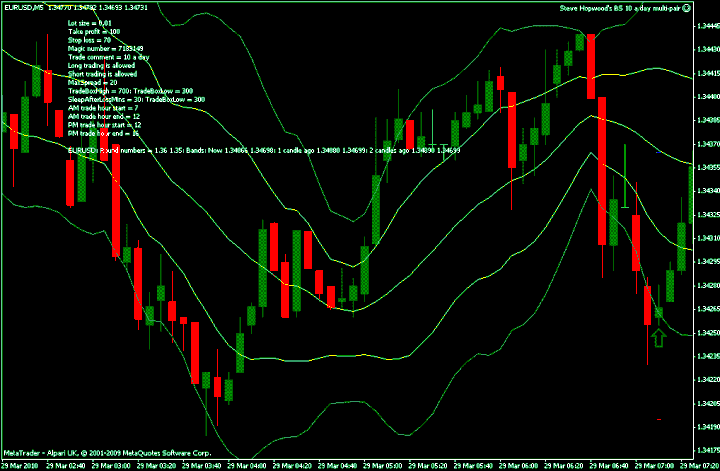
In the pictures  BS 10 pips a day in action.
Here is an example Long trade from my demo this morning. The green arrow marks the
candle when the trade was sent – see 4 candles back from the right of the picture. The two
previous candles had both closed beneath the bottom BB line. With the trade taken at
1.34265, the nearest round number was a long way away.

A few points to note:
• This is scalping for a few pips at each trade. You can only trade this way with
low-spread pairs, hence the low MaxSpread setting.
• This method 'wins' 7\10 times, according to BS. This means that strings of losers do
happen.

When two successive losers occur, then we assume that there is something going
on in the market that we do not know about, and step aside for half an hour or so.
• BS states in his final video that this is not a 'trading strategy' on its own, and that the
trader needs experience and judgement to know when to trade and when not to
trade.
• BS states in his final video that this trading method cannot be automated profitably.
• TradeBoxHigh and TradeBoxLow define the trading box, by default 70(0) pips
above the nearest round low and 30(0) above it. The

Download
BS 10 pips a day forex system Templete
Steve's bollinger bands.rar
compressed file archive 1011 Bytes
Download
Trading robots.zip
Compressed Archive in ZIP Format 146.1 KB

Share your opinion, can help everyone to understand the forex strategy.