Submit by Forexstrategiesresources
1. THE CHART SETUP:
1.1 Charts & pairs:
1.1.1 5 min candle chart
1.1.2 The following 4 pairs:
· EUR$
· GBP$
· JPY$
· EURJPY
1.2 Indicators on chart itself:
1.3 SMAangle window:
1.3.1 SMAangle indicator
1.3.2 21 EMA based on first indicator data overlaying this indicator (see Attachment A)
1.3.3 Put the following horizontal lines on the SMAangle indicator:
· 0.1, & -0.1, on the EURU$, GBPU$ & U$JPY pairs
· 0.15 & -0.15 on the EURJPY pair
· 0.4 & -0.4 on all 4 pairs
1.4 ADX window:
1.4.1 Open a ADX indicator in separate window set @ 13
1.4.2 Overlay it with an lsma 3 indicator from HelloDollie safe pips thread
2. THE TRADE CRITERIA:
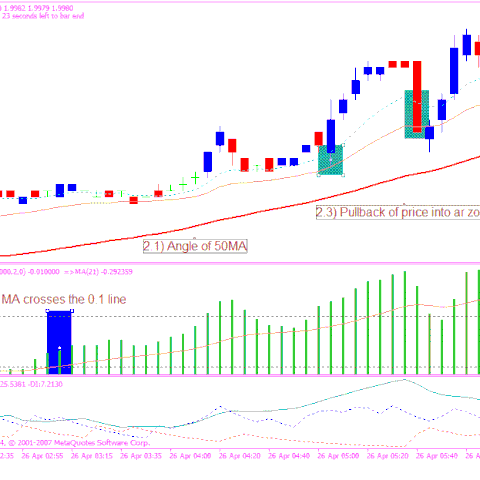
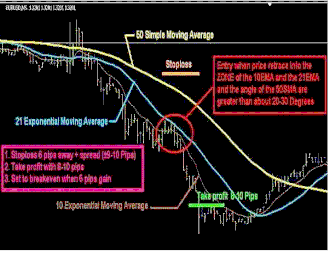
Criterion 1: 50SMA angle to be more that 20 degree
2.1.1 It is a subjective measurement and it is not an accurate measurement.
2.1.2 It was used in the beginning of the thread) and we changed late to the 21MA on the
SMAangle indicator as a guide (as explained in Criterion 2).
2.1.3 But it is still very applicable for this system because the angle of the 50MA is the
main principle behind the system
Criterion 2: 21EMA on SMAangle indicator to cross the 0.1 or -0.1/0.15 or -0.15 line.
2.2.1 The area between the 0.1 and -0.1 lines is called the no-trade zone.
2.2.2 No trades to be taken if 21MA is in the no-trade zone.
Criterion 3: The price to pull back through 10EMA to 21EMA
2.3.1 The area between 10MA & 21MA is called the fire or war zone
Criterion 4: The price should stay on the correct side of the small resistance/support line
2.4.1 Draw (Appendix B) a small trend line from the:
Last High or Low before the cross of the 51MA
Next high/s or low/s to form a small resistance/support line
2.5 Optional – SMAangle bars to be higher or lower than 0.2 or -0.2 line (I don’t use it any more
THE TRADE SET-UP:
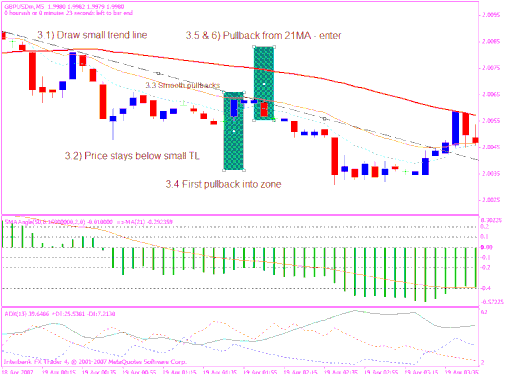
3.1.1 Ensure that the price and candles stay on the correct side of the small trend line.
3.1.2 Any break-out cancels the set-up/possible trades
Rule 2: Specific manner of pullback of candles towards war zone:
3.2.1 Smooth and flat pullback of candles – no steep pullback
3.2.2 Smooth rounding of top/bottom (wave-like pullbacks) – no sharp V shape change of direction
3.2.3 Ascending of descending triangle being formed between resistance/support level and small trend line drawn
Rule 3: Pullback into war zone:
3.3.1 Identify the first candle to enter the war zone towards 21MA
3.3.2 Wait for second/more candle to pull back from 21MA towards 10MA
3.3.3 Enter the trade on the pullback a few pips away from the 21MA
Rule 4: Additional ADX rule (not yet fully tested):
3.4.1 For a long trade, the positive line (Blue) must be above the negative line (Red) with Isma line crossed the red line to go in between Blue and red line
3.4.2 For a short trade, the negative line (Red) must be above the positive line (Blue) with Isma line crossed the blue line to go in between Blue and red line.
3.4.3 The trend line must be above 25 level
3.4.4 If the ratio between the positive and negative line is almost 2:1, expect the pullback only up to the 10MA and enter the trade.
4. THE TRADE:
4.1 Use a market order to enter within the war zone as specify
4.2 Put Stop Loss 6+spread pips away
4.3 Move stop loss to breakeven after a clean 6 pips gain/profit (brokerage/spread included
4.5 Put/activate profit limit on 10-15 pips
4.6 There are plenty of chances to get in a trade:
4.6.1 Don’t try to trade every signal that might work
4.6.2 Wait for the good setup to occur
4.6.3 Wait for the High probability ones
4.6.4 Rather miss an opportunity than to get involve in a bad/wrong set-up
4.7 The Entry looks:
4.7.1 Small candles
4.7.2 Flat type of pull back
acsending or decending triangle awaiting a breakout within the war zone.
(Adapted from Original developer – Phillip Nel from Forex Faxctory)