пятница, 17 ноября 2017 г.

Scalping Action with BBstop

Day trading with Bollinger Bands Stop

Price action with Zig Zag and BBStop.

Submit by Florien

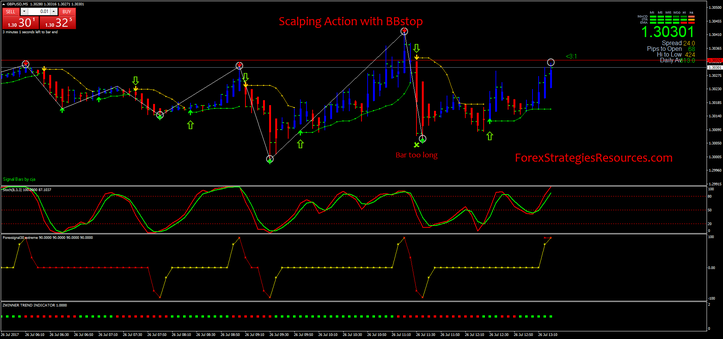
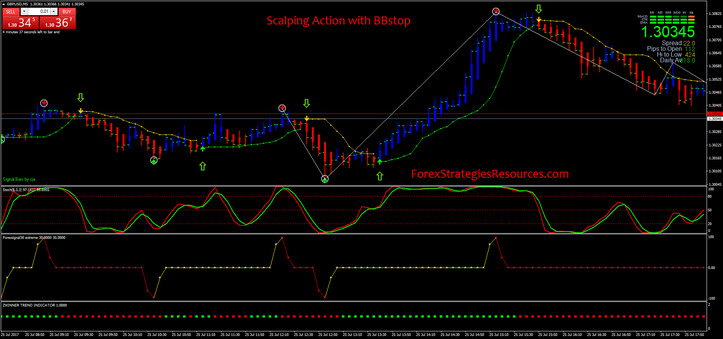
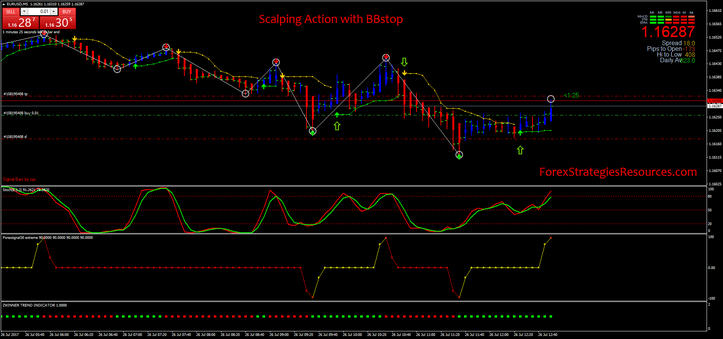
Scalping Action with Bbstop is a trend-momentum price action strategy for day trading. Price action because for filter there is also a high/low zig zag indicator.
I like this trading method, but in later stages can generate false signals.

Time frame 5 min or 15 min.


Currency pairs majors with low spread.
Trading Sessions: London and New York. Do not trades before the news.
Metatrader 4 Indicators
GP clock,
Signals bars V.6,
Cleon Heiken Aschi,
GWS Zig Zag point,
Super Signals V.2a,
Zig Zag take profit,
BBstop alert (8, 1, money risk 1.0),
Stochastic oscillator (8,3,3),
Forex signal 30 (high/low),
Zwinner Trend Indicator (price action indicator repaint).

Trading rules Scalping Action with Bbstop
Buy
BBstop alert buy arrow.
Cleon Heiken Aschi blue bar,
Stocastic oscillator crosses upward,
Forex signal 30 yellow dot,
Zwinner trend green bar.
Place initial stop loss below the previous low swing.
Profit Target 5-12 pips (5 min time frame)

Sell
BBstop alert sell arrow.
Cleon Heiken Aschi red bar,
Stocastic oscillator crosses upward,
Forex signal 30 red dot,
Zwinner trend red bar.
Place initial stop loss above the previous high swing.
Profit Target 5-12 pips (5 min time frame).


In the pictures Scalping Action with BBstop.
Scalping Action with BBstop
Share your opinion, can help everyone to understand the forex strategy

Download
Scalping Action with BBstop
Scalping Action with BBstop.rar
compressed file archive 129.5 KB


Stochastic OS/OB Strategy

Stochastic Overbought and Oversold

Value chart trading with Stochastic OS/OB with Support and Resistance

Submit by FreddyFX

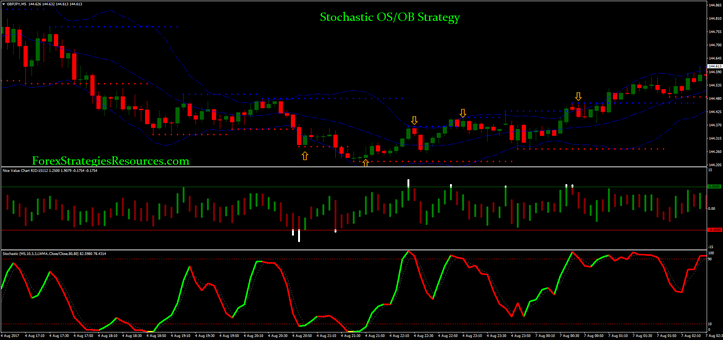
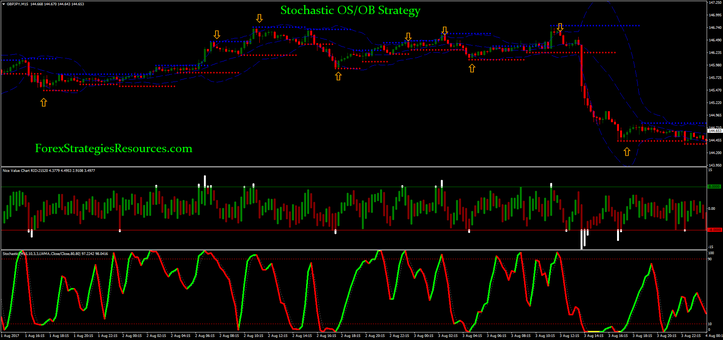
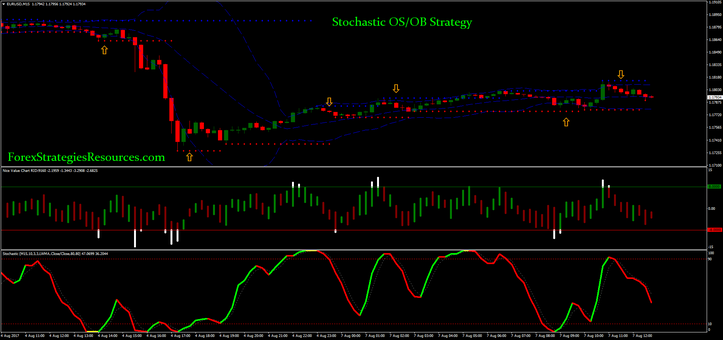
Stochastic OS/OB Strategy is a trend reversal strategy based on bollinger Bands, stochastic oscillator, Support and Resistance levels and Value Chart for direction of the trades.
Time frame 5 min or 15 min.

Currency pairs: majors with low spreads.


Metatrader Indicators:
Bollinger Bands (period 20, deviation 2.0),
Supprt RTF period 11,
Nice Value chart V.1.0,
Stochastic oscillator (10, 3, 3) with level (10 – 90).

Trading rules Stochastic OS/OB Strategy
Buy
Price outer the lower band of BB.
Value chart with white bar.
Red dot support level.
Stochastic crosses upward the 10 level (green color line).
Place a buy order at opening of the next candle.
Initial stop loss at the privious low swing.
Make profit with fast profit that depends by time frame and pairs, max ratio stop loss 1:1.

Sell
Price outer the upper band of BB.
Value chart with white bar.
Green dot resistance level.
Stochastic crosses downward the 90 level (green color line).
Place a sell order at opening of the next candle.
Initial stop loss at the privious low swing.
Make profit with fast profit that depends by time frame and pairs, max ratio stop loss 1:1.

You can use, for money management the martingale. Multiplier range min 1.4 – max 2.0.


In the pictures Stochastic OS/OB Strategy in action.
Stochastic OS/OB Strategy
Share your opinion, can help everyone to understand the forex strategy.

Download
Stochastic OS/OB Strategy
Stochastic OSOB Strategy.rar
compressed file archive 49.7 KB

четверг, 16 ноября 2017 г.

FX Daily Trend

Fx Daily Trend with Bollinger Bands

Day trading strategy

Submit by Larry 2017


FX Daily Trend is an indicator that find the direction of the market for trading intraday for six majors pairs. This tool Metatrader 4 can be used for build intraday forex strategies: trend following, momentum, trend momentum and with Bollinger Bands. The first strategy that show is Fx Daily Trend with two Bollinger Bands.


Time Frame 15 min.
Currency pairs: EUR/USD, GBP/USD, AUD/USD, USD/CHF, USD/CAD, USD/JPY.
Metatrader Indicators:
FX Daily Trend ( show following pairs: EUR/USD, GBP/USD, AUD/USD, USD/CHF, USD/CAD, USD/JPY);
Bollinger Bands (period 30, deviation 2.0);
Bollinger Bands (period 30, deviation 3.0);

Trading rules Fx daily trend with bollinger bands
Wait that FX Daily Trend draws on the chart the direction of the market.
Buy
FX Daily Trend Buy arrow.
When the price touches or breaks the lower Bollinger Band (30, 3) wait that price action close into the Bollinger Bands (30, 2) and palce a buy order at the opening of the next bar.
Place initial stop loss below the lower band of BB (30, 3).
Profit Target 8-14 pips depend by pairs or at the middle band.

Sell
When the price touches or breaks the upper Bollinger Band (30, 3) wait that price action close into the Bollinger Bands (30, 2) and palce a sell order at the opening of the next bar.
Place initial stop loss above the upper band of BB (30, 3).
Profit Target 8-14 pips depend by pairs or at the middle band.


FX Daily Trend in general it can be a winning trading method, also if associated with other (trend or momentum) strategies.
In the pictures Fx daily trend with Bollinger Bands in action.


FX Daily Trend
FX Daily Trend


FX Daily Trend
FX Daily Trend


FX Daily Trend
FX Daily Trend

Share your opinion, can help everyone to understand the forex strategy.

Download
FX Daily Trend
FX Daily Trend with Bollinger Bands
fx daily trend.rar
compressed file archive 12.9 KB

Dema Day Trading Strategy

Dema Trading RLH2

Simple Trend Following Strategy

Submit by Tim 2017


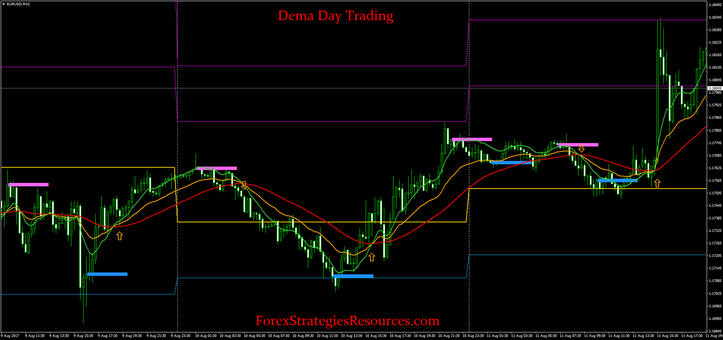
Dema Day Trading Strategy is simple and easy trading system trend following based on Dema indicator RLH2 Metatrader 4. The purpose of this strategy is find the intraday trend, this system is good for this purpose.


Time frame 15 min or 30 min.
Currency pairs: EUR/USD, USD/JPY, GBP/USD, AUD/USD, USD/CAD, GBP/JPY, EUR/GBP, EUR/JPY.
Metatrader 4 Indicators
Dema RLH2 20 period, close.
Dema RLH2 indicator consists in three moving averages ( High, Medium and Low).
Pivot Daily SR.
4X Xard wave (Zig Zag: SR 3, SRZZ 12, Main RZZ 12, FP 12, SMF 3).

Trading rules Dema Day Trading Strategy
Buy
Wave support formed.
Green line above, yellow line and red line.
Advanced entry : wait that the price retraces on the green line, (optional).
Profit Target on the Pivot points levels.
Initial stop loss 1 pips below wave support.

Sell
Wave resistence formed.
Green line below, yellow line and red line.
Advanced entry : wait that the price retraces on the green line, (optional).
Profit Target on the Pivot points levels.
Initial stop loss 1 pips above wave resistance.


This strategy is suitable for providing forex signals during London and New York Sessions.
Disadvantages: this is a trend following system, and in sideways market can generates false signals.

Advantages: very simple and it's easy for recovery of the trades loses.


In the pictures Dema Day Trading Strategy in action.

Dema Day Trading Strategy


Dema Day Trading Strategy

Share your opinion, can help everyone to understand the forex strategy.

Download
Dema Day Trading Strategy.rar
compressed file archive 10.3 KB

Crane Scalper

Crane Scalper with RSX Sig Histo Indicator

Super Trend Momentum Strategy

Submit by Mario 2017

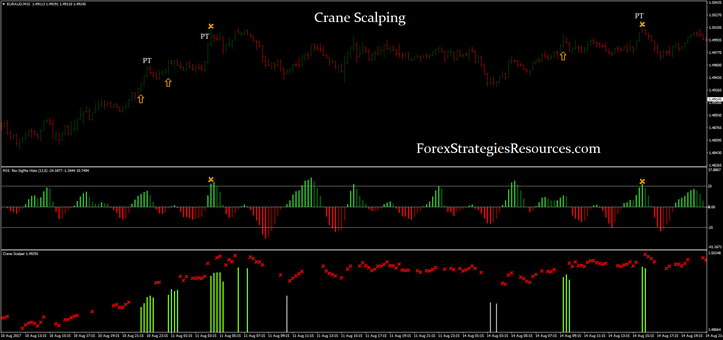
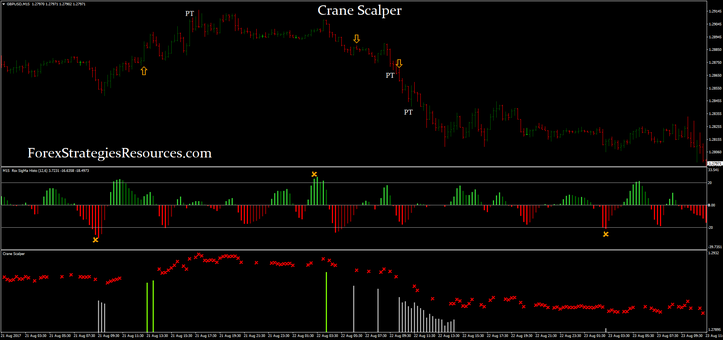
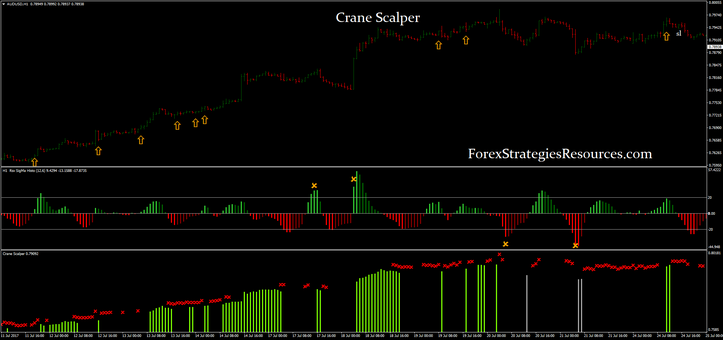
Crane Scalper is a trend momentum strategy based on two indicators Crane Scalper for entry and RSX Sig Histo Indicator as filter. The main feture of this strategy is that the entries are only in the direction of the main trend and there is also the filter of OS/OB.
Time Frame 5 min or higher

Currency pairs with low spreads.


Metatrader 4 Indicators
Crane scalper period1 11, period2 12.
RSX Sig Histo Indicator period 12 with levels ob/os 20 and -20.
RSX Sig Histo Indicator is an indicator that you can use also for reversal trading.

Trading Rules Crane Scalper
Buy
Crane scalper green bar.
RSX Sig Histo Indicator green bar but below of level 20.
Fast profit target that depends by time frame and pairs.
Place initial stop loss below the low swing.

Sell
Crane scalper red bar.
RSX Sig Histo Indicator red bar but above of level -20.
Fast profit target that depends by time frame and pairs.
Place initial stop loss above the high swing.

Advantages of this trading system is simple and fast trades with a good filter.

Disadvantages are few signals then you must apply this template a more pairs and time frame in the same time.


In the pictures Crane Scalper in action.

Crane Scalper
Crane Scalper


Crane Scalper
Crane Scalper


Crane Scalper
Crane Scalper

Share your opinion, can help everyone to understand the forex strategy.

Download
Crane Scalper
Crane Scalper
Crane Scalper.rar
compressed file archive 59.1 KB